GoogleChartStyles by Weekdone
Better default Google Chart styles, just copy and paste to your project.
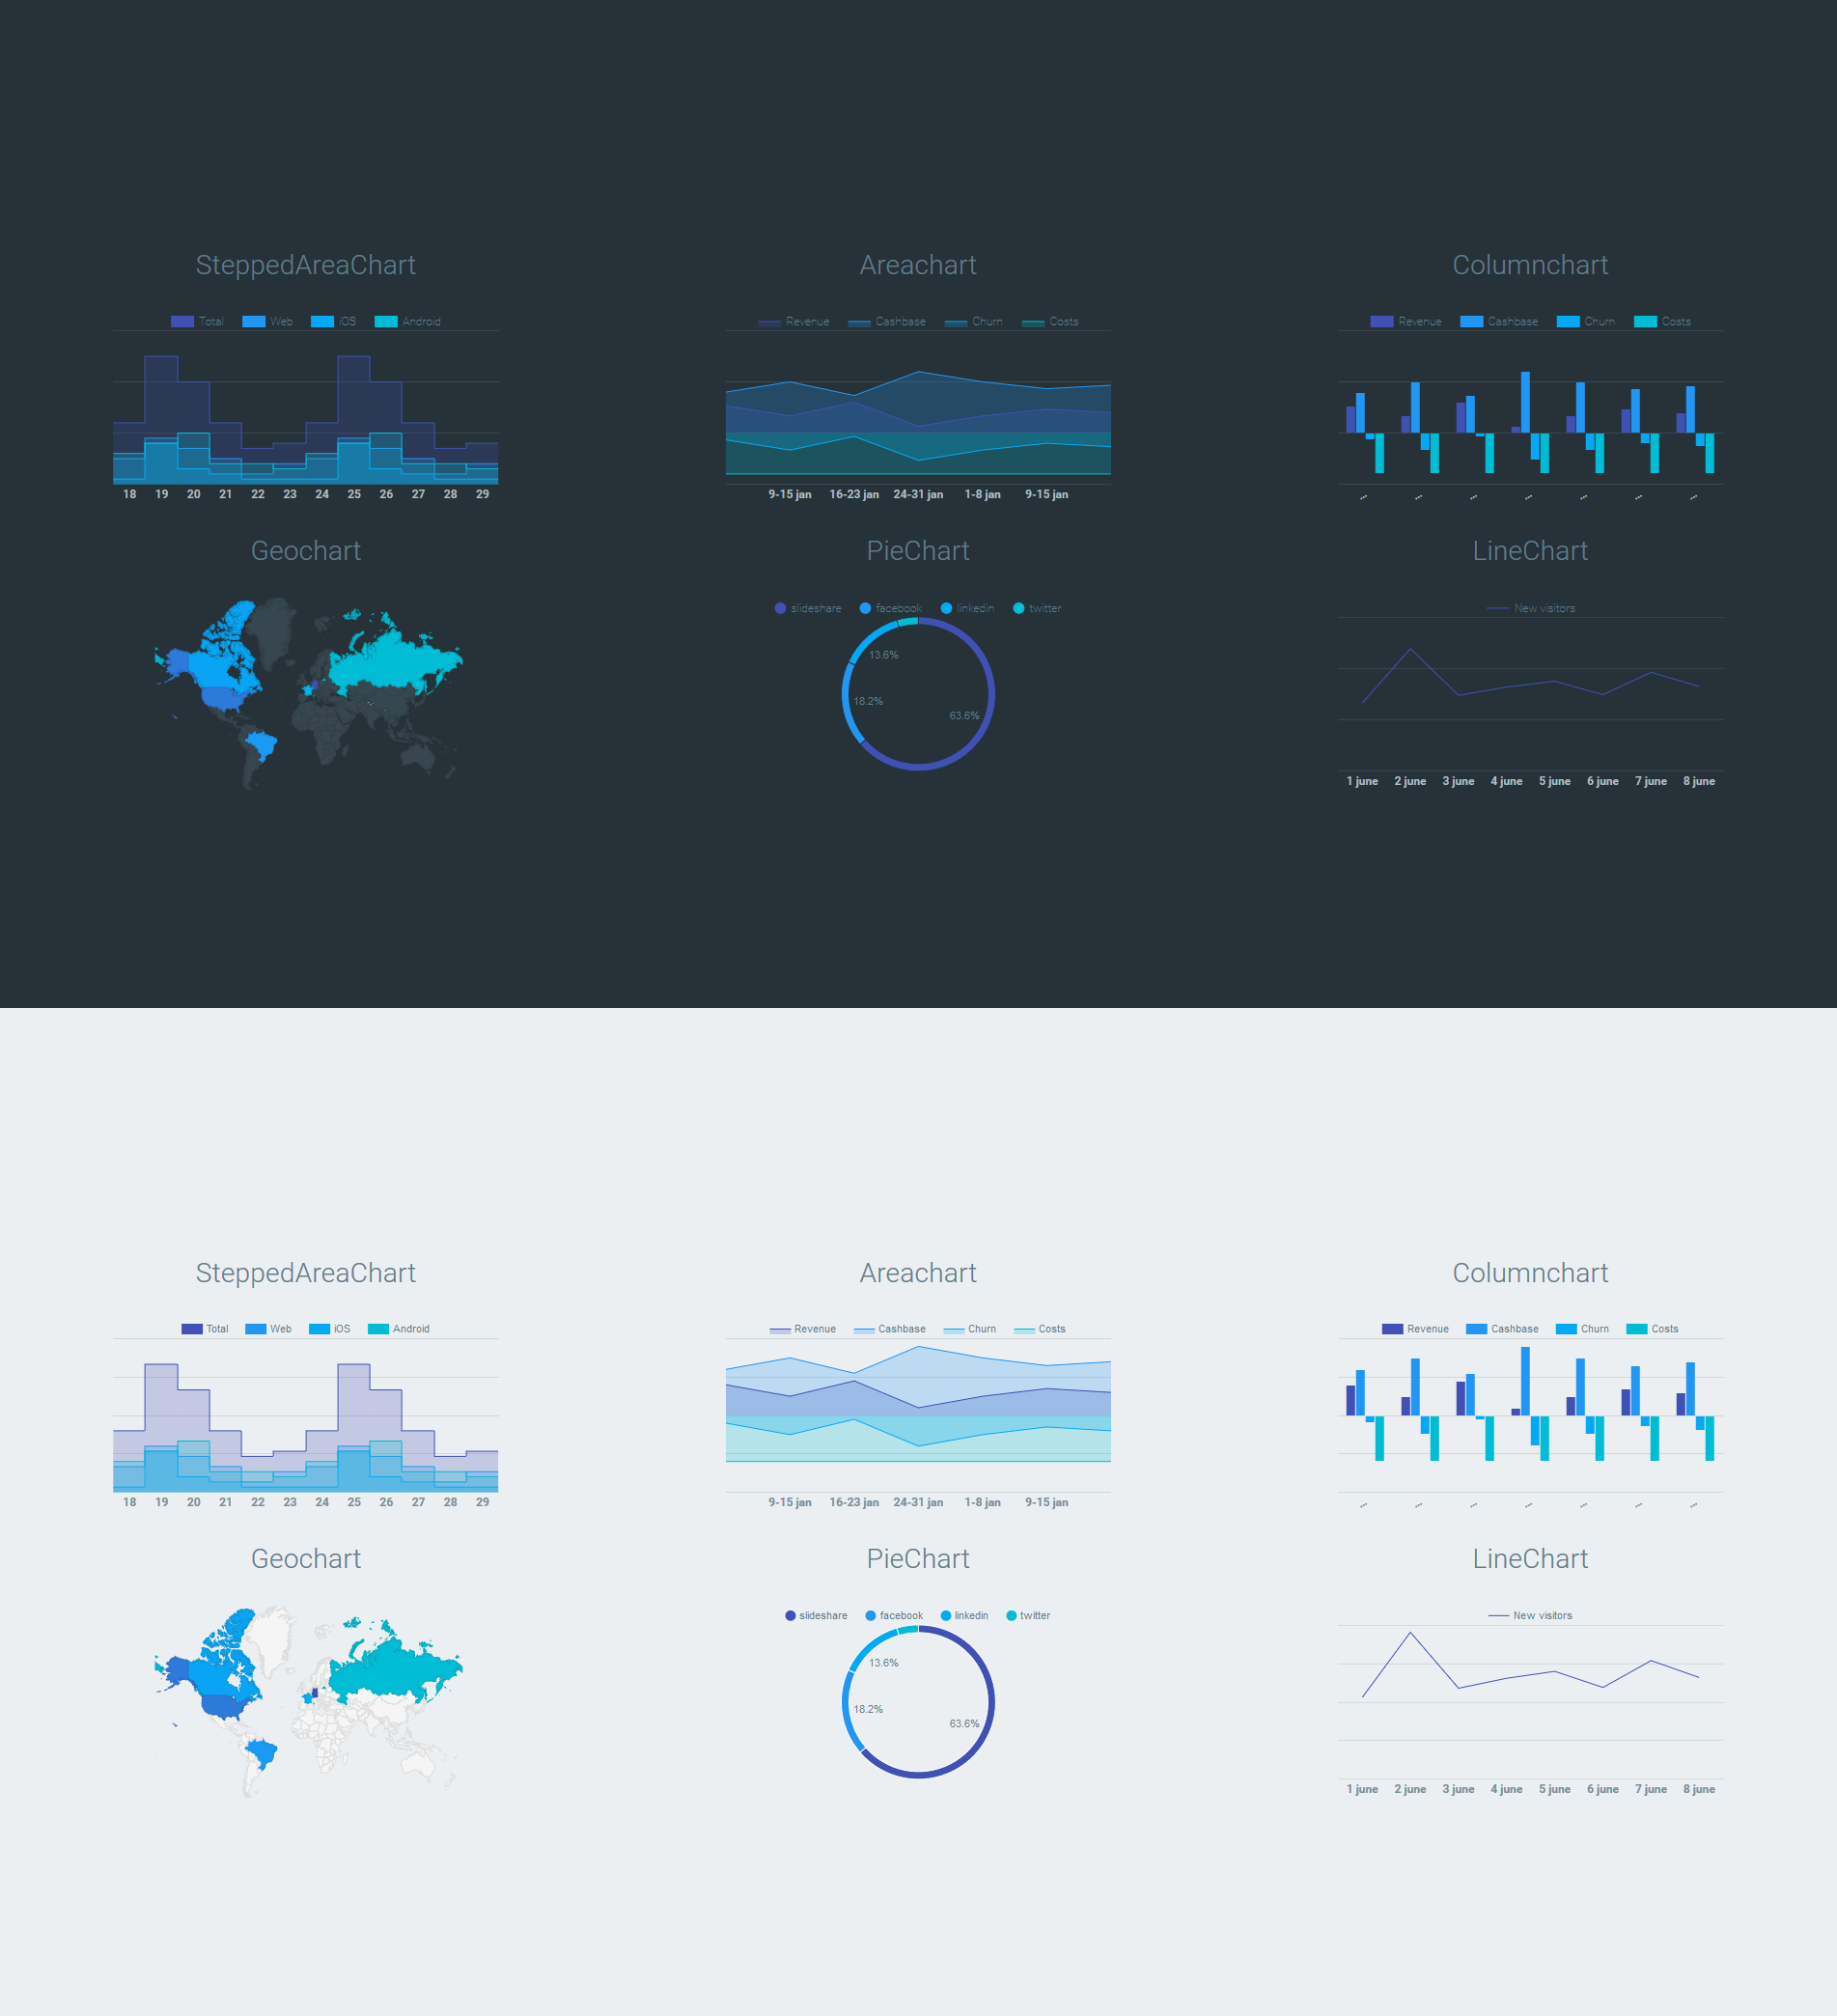
- plug-and-play
- light and dark modes
- Set up your Google Charts as usual
- Copy and paste the
optionsparameters - Enjoy better looking charts
Useful for:
- web apps
- KPI dashboards
- anything
var options = {
  hAxis: {
    titleTextStyle: {color: '#607d8b'},
    gridlines: { count:0},
    textStyle: { color: '#b0bec5', fontName: 'Roboto', fontSize: '12', bold: true}
  },
  vAxis: {
    minValue: 0,
    gridlines: {color:'#37474f', count:4},
    baselineColor: 'transparent'
  },
  legend: {position: 'top', alignment: 'center', textStyle: {color:'#607d8b', fontName: 'Roboto', fontSize: '12'} },
  colors: ["#3f51b5","#2196f3","#03a9f4","#00bcd4","#009688","#4caf50","#8bc34a","#cddc39"],
  areaOpacity: 0.24,
  lineWidth: 1,
  backgroundColor: 'transparent',
  chartArea: {
    backgroundColor: "transparent",
    width: '100%',
    height: '80%'
  },
      height:200, // example height, to make the demo charts equal size
      width:400,
      pieSliceBorderColor: '#263238',
      pieSliceTextStyle:  {color:'#607d8b' },
      pieHole: 0.9,
      bar: {groupWidth: "40" },
      colorAxis: {colors: ["#3f51b5","#2196f3","#03a9f4","#00bcd4"] },
      backgroundColor: 'transparent',
      datalessRegionColor: '#37474f',
      displayMode: 'regions'
    };