Repository navigation
"x.py check" that does nothing feels like it has gotten slower #133162
Description

When working on the UI test suite, it is common to hit Ctrl-S in the IDE and then quickly switch to a terminal to run the test. Since RA triggers a check-on-save, this means that the tests can only start running once the check-build is completed. However, since nothing in the compiler changed, this check-build should be completed very quickly.
However, some time recently this seems to have gotten significantly slower. I now usually have to wait for multiple seconds before a test build can start, which was not the case in the past. This is on a system with an NVMe SSD and a pretty good CPU (pretty good for a laptop, anyway) -- it should be plenty fast enough for this.
To reproduce, run ./x check compiler, wait until it is completed, and then run time ./x check compiler. The result is:
$ time ./x check compiler
Building bootstrap
    Finished `dev` profile [unoptimized] target(s) in 0.27s
Checking stage0 library artifacts (x86_64-unknown-linux-gnu)
    Finished `release` profile [optimized + debuginfo] target(s) in 0.14s
Checking stage0 compiler artifacts {rustc-main, rustc_abi, rustc_arena, rustc_ast, rustc_ast_ir, rustc_ast_lowering, rustc_ast_passes, rustc_ast_pretty, rustc_attr, rustc_baked_icu_data, rustc_borrowck, rustc_builtin_macros, rustc_codegen_llvm, rustc_codegen_ssa, rustc_const_eval, rustc_data_structures, rustc_driver, rustc_driver_impl, rustc_error_codes, rustc_error_messages, rustc_errors, rustc_expand, rustc_feature, rustc_fluent_macro, rustc_fs_util, rustc_graphviz, rustc_hir, rustc_hir_analysis, rustc_hir_pretty, rustc_hir_typeck, rustc_incremental, rustc_index, rustc_index_macros, rustc_infer, rustc_interface, rustc_lexer, rustc_lint, rustc_lint_defs, rustc_llvm, rustc_log, rustc_macros, rustc_metadata, rustc_middle, rustc_mir_build, rustc_mir_dataflow, rustc_mir_transform, rustc_monomorphize, rustc_next_trait_solver, rustc_parse, rustc_parse_format, rustc_passes, rustc_pattern_analysis, rustc_privacy, rustc_query_impl, rustc_query_system, rustc_resolve, rustc_sanitizers, rustc_serialize, rustc_session, rustc_smir, rustc_span, rustc_symbol_mangling, rustc_target, rustc_trait_selection, rustc_traits, rustc_transmute, rustc_ty_utils, rustc_type_ir, rustc_type_ir_macros, stable_mir} (x86_64-unknown-linux-gnu)
    Finished `release` profile [optimized + debuginfo] target(s) in 1.70s
Build completed successfully in 0:00:05

real	0m5,650s
user	0m5,324s
sys	0m0,334s
As you can see, there are less than 2s spent inside cargo. And yet overall this took more than 5s. This means that bootstrap spent 3s doing... something? Whatever it did takes two times longer than cargo took to verify that the entire compiler sources remain unchanged.
Would be nice to find a way to speed that up. :)
Cc @rust-lang/bootstrap
Activity
Kobzol commentedon Nov 18, 2024
It takes ~1s on my laptop. Have you tried running
git gc?RalfJung commentedon Nov 18, 2024
That does help quite a bit, thanks for the hint:
Still, ~68% of the runtime of this command are spent in bootstrap, not in cargo.
Kobzol commentedon Nov 18, 2024
Could you please generate a flamegraph of this invocation? There is a
perfcommand for gathering the trace shown here: #126423 (comment) Or you can use e.g. https://github.com/flamegraph-rs/flamegraph or https://github.com/mstange/samply.the8472 commentedon Nov 19, 2024
gc doesn't run for submodules, you'll have have to do
git submodule foreach git maintenance runRalfJung commentedon Nov 19, 2024
That doesn't really change anything.
RalfJung commentedon Nov 24, 2024
Gathering the perf trace is easy, but now it's already been 10 minutes and it's still not produced a flamegraph from that... how long of a wait is normal here? It seems like it's spawning thousands of addr2line processes (and it's entirely sequential, most of my CPU cores are idle).
Kobzol commentedon Nov 24, 2024
Oh, yes, this is a super annoying performance bug with
perfthat occurs on some Debian-based systems (maybe also somewhere else) 😿 https://eighty-twenty.org/2021/09/09/perf-addr2line-speed-improvement, flamegraph-rs/flamegraph#74 contains the description of the issue and how it can be solved. flamegraph-rs/flamegraph#74 (comment) is perhaps the easiest fix.RalfJung commentedon Nov 24, 2024
Those issues were fixed years ago (https://git.kernel.org/pub/scm/linux/kernel/git/torvalds/linux.git/commit/?id=be8ecc57f180415e8a7c1cc5620c5236be2a7e56), there must be something else going on I think?
RalfJung commentedon Nov 24, 2024
Oh yeah, with gimli's addr2line this finishes basically immediately. Wtf?
RalfJung commentedon Nov 24, 2024
Here's a flamegraph:
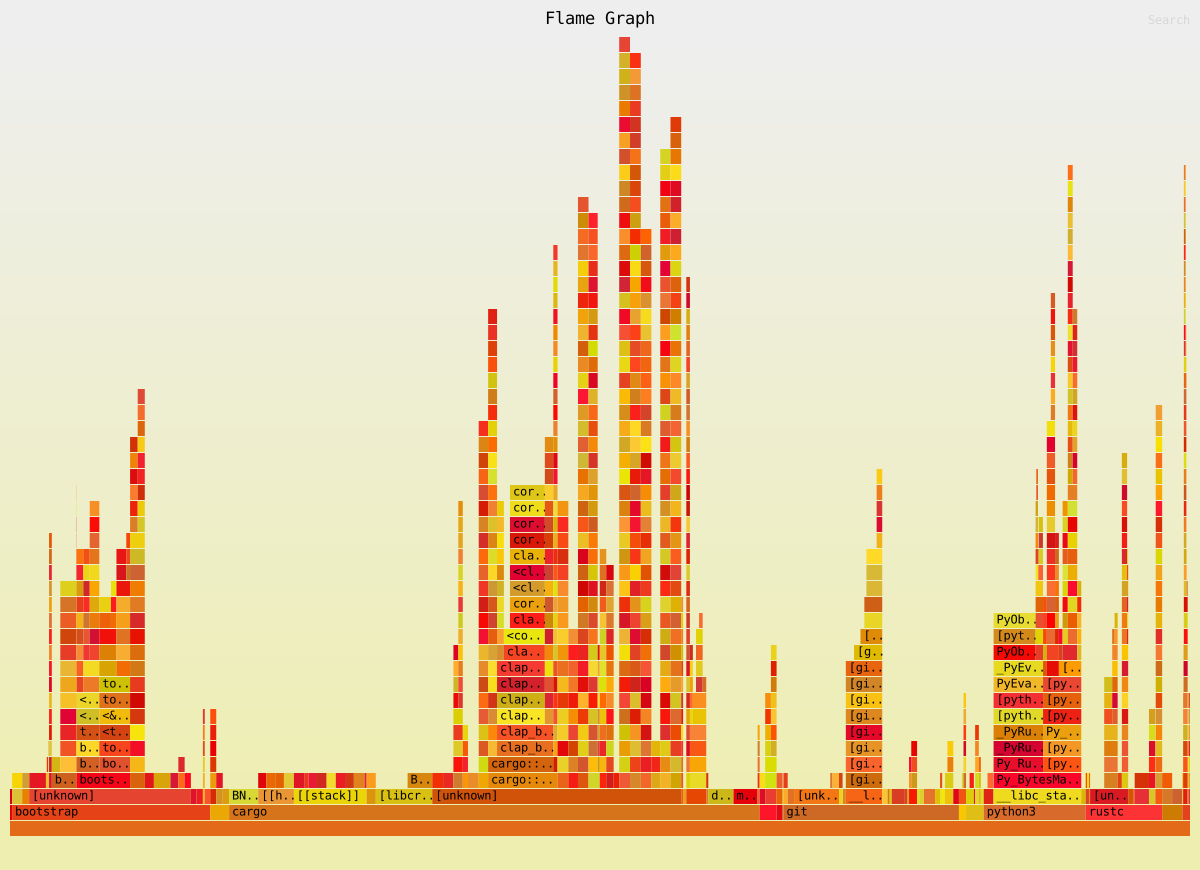
I have no idea how to navigate these things...
the8472 commentedon Nov 24, 2024
Github adds CSP headers that disable javascript in the SVG, that disables some interactive effects in the flamegraph. So one has to download the file and then open it.
Comparing it to my system yours spends more time in
maybe_download_ci_llvm. Though our profiles look quite different. Not sure if this is due to a difference in debuginfo or different sampling rates or genuine... 🤔 do you have cargo or rustc overriden inconfig.tomlwith one that has more debug asserts enabled?RalfJung commentedon Nov 24, 2024
Ah, good point, I have cargo overriden there to test #132390 🤦 Sorry for that!
Using the bootstrap cargo speeds things up a lot:
OTOH now >80% of the time are spent inside bootstrap. Here's a new flamegraph:
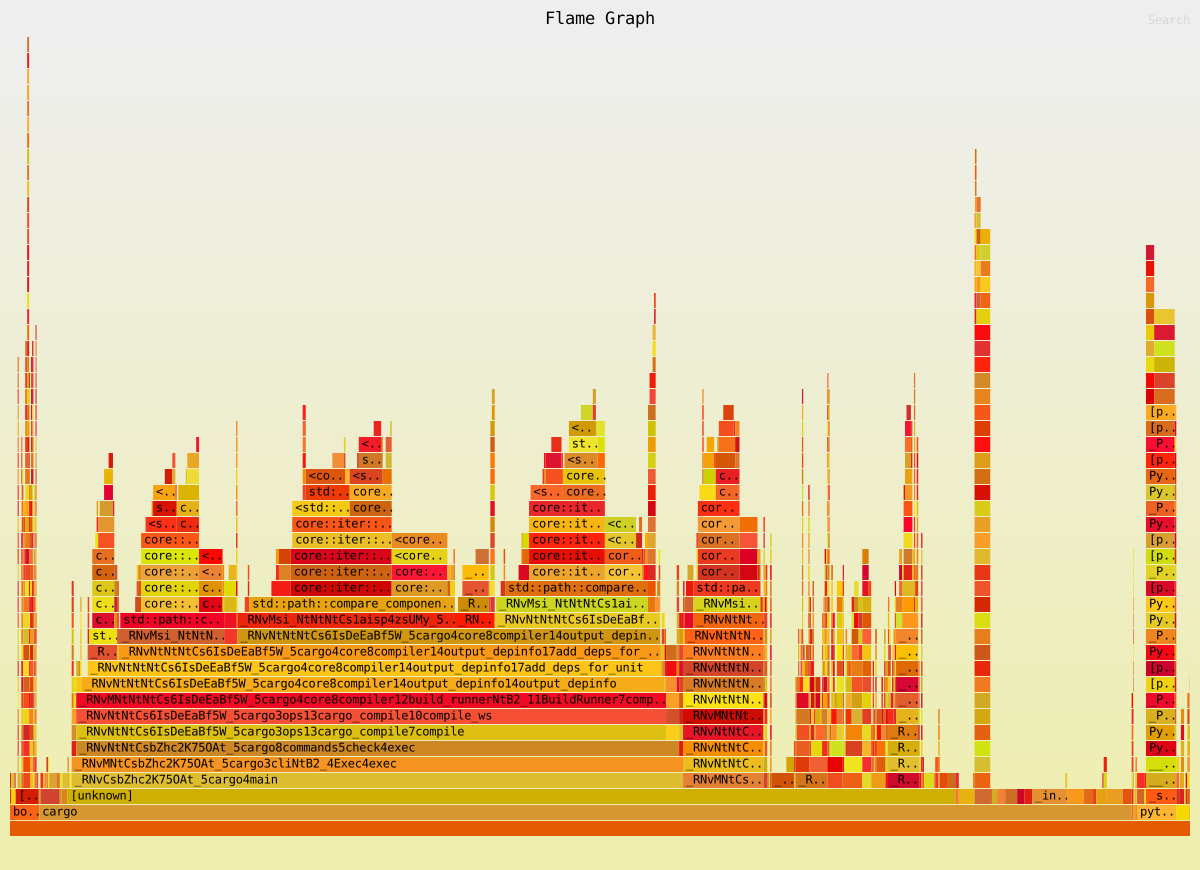
RalfJung commentedon Nov 24, 2024
Interestingly the flamegraph says most of the time is spent in cargo. That's odd, it doesn't add up with the times that are printed on the terminal. Or is that all time spent dynamically linking and launching cargo, before cargo's own time measurements begin?
Anyway, around 1s for a NOP
checkseems acceptable. :)Kobzol commentedon Nov 24, 2024
Looks like now most of the time is spent inside Cargo, it's just not obvious from the stderr log. I think that bootstrap invokes Cargo many more times than just the two invocations shown in stderr, and it swallows the output (for good reasons, otherwise it would be super spammy).
RalfJung commentedon Nov 24, 2024
Ah, that makes sense. Makes me wonder if it can be reduced, but then again, it's not adding up to a whole lot -- 1s feels a lot faster than 5s.
RalfJung commentedon Dec 7, 2024
So, there's no recent slowdown here. :)