


Hi there 👋, welcome to my profile
- 📊 I use rigorous data analytics and strategic intelligence to turn complex, messy data into actionable business intelligence 📈 and long-term strategic decisions 🎯.
- 🌐 International relations graduate specialised in data analysis and strategic foresight 🔮 — transforming chaos to clarity ✨ and moving from uncertainty to opportunities 💡.
- 🚀 Currently advancing into Data analysis and Applied AI & Data Science Solutions 🤖.
- ⚡ Fun fact: I love Dachshunds; hoping to fulfil my dream to have one or two little wieners to join me while I code
- 📧 Email: [email protected]
- 📱 Phone: +52 220 501 4335
- 🌍 Languages: English & Spanish (Bilingual), Intermediate French
- 💻 Availability: High preference for Remote roles
- 🌐 Portfolio: maxsantana-data2strategy.github.io
-
Data Analytics & BI: SQL, Python (
pandas,numpy,seaborn,matplotlib), R (tidyverse,ggplot2), Power BI, Tableau, RStudio, Jupyter, Google Colab. -
Core Technical Focus: End-to-end data pipelines, cleaning raw datasets (100k+ records), data modeling, statistical forecasting, and dynamic dashboard design.
-
Business & Strategy: Business question-oriented analysis, KPI framework design, executive communication (CFI consulting framework), decision support, and stakeholder alignment, Project Management, Conflict resolution
-
Strategic Foresight & Risk Analysis: Strategy facilitation, scenario planning, horizon scanning, geopolitical risk analysis, actor mapping, long-term scenario building under uncertainty, HUMINT, and OSINT.
-
Social Science & Research: Qualitative research (expert consultations, interviews, surveys, focus groups), public policy analysis, and political economy.
Territorial Profitability Analysis — Adventure Works
Determine where to allocate marketing spend for maximum ROI across territories by analyzing revenue, costs, and marketing investment.


- Schema Integration — Joined 6 tables (sales, products, categories, territories, campaigns) using
clave_territorioandclave_producto - Data Cleaning — Calculated
ingreso_totalandcosto_totalper order, handled NULLs with COALESCE - KPI Calculation — Aggregated revenue, gross profit, margin %, and ROI % by territory
- Validation — Reconciled totals across joins, confirmed no data anomalies
SQL (JOINs, GROUP BY, aggregations, COALESCE, NULLIF) | Relational database with 6 tables | Data validation & QA
| Country | Revenue | Margin % | ROI % |
|---|---|---|---|
| 🇺🇸 USA | $3.35M | 43.4% | 75.8% ⭐ |
| 🇦🇺 Australia | $2.53M | 41.7% | 49.2% |
| 🇬🇧 UK | $1.19M | 42.7% | 22.1% |
| 🇩🇪 Germany | $1.07M | 42.9% | 20.3% |
| 🇫🇷 France | $0.92M | 42.9% | 17.9% |
| 🇨🇦 Canada | $0.71M | 44.8% | 17.4% |
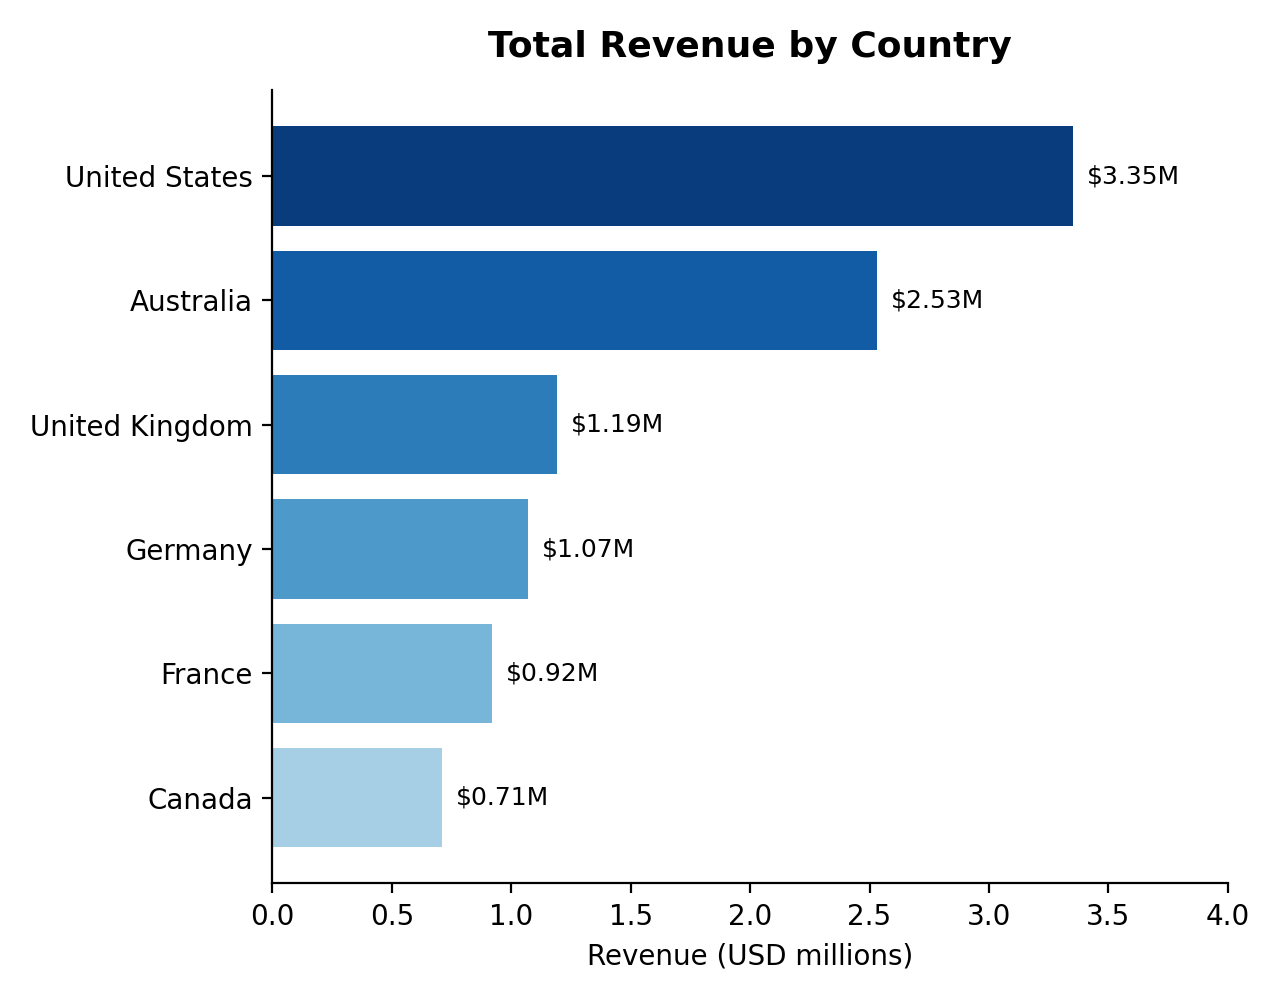
USA leads with 75.8% ROI on $1.92M spend. Australia (49.2% ROI) punches above weight. UK underperforms with only 22.1% ROI despite $2.3M investment. All margins healthy (41–45%), but ROI divergence driven by marketing spend efficiency.
Recommendation: Reallocate ~$500K from underperforming EU/CA markets to USA/Australia for 30–40% ROI improvement.
ConnectaTel — Customer Behavior & Usage Segmentation
Determine which customers drive the most value for a Latin American telecom by cleaning usage data, resolving data-quality issues, and segmenting customers by usage intensity and age.
- Data Quality Diagnosis — Detected sentinel values (
age= -999,city= '?'), impossible dates (40 records dated 2026), and confirmedduration/lengthnulls were Missing At Random by usagetype - Cleaning — Replaced sentinels, standardized dates, and preserved MAR nulls as meaningful signal rather than imputing them away
- Feature Engineering — Aggregated 40,000 usage records into a per-user profile (messages, calls, call minutes)
- Outlier & Segmentation Analysis — Used IQR and Z-scores to identify power users, then segmented all 4,000 customers by usage (
Low/Medium/High use) and age
Python (pandas, numpy) | seaborn, matplotlib | IQR & Z-score outlier detection | Rule-based segmentation | Google Colab
Medium use is the largest usage segment; a consistent minority of 21–47 users per metric are high-volume "power users" retained as an upsell target rather than cleaned away as noise. Basic plan dominates every segment, including the heaviest users, pointing to under-monetized power users.
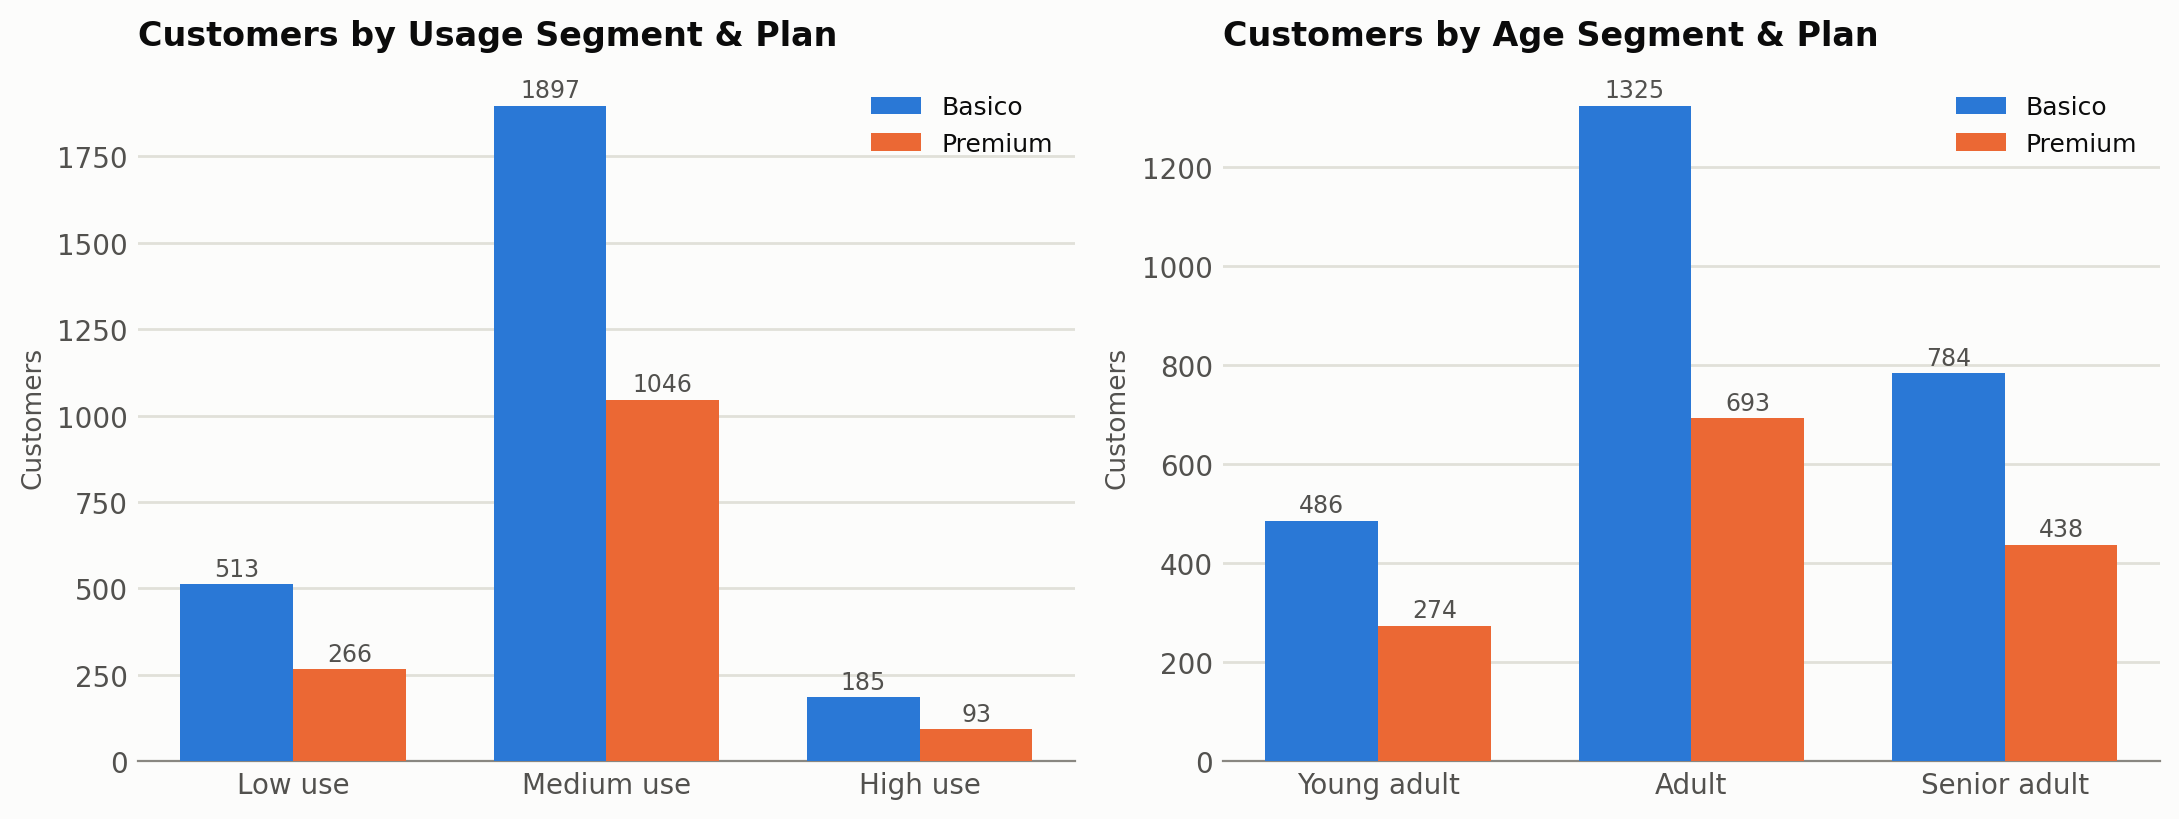
Outliers were the opportunity, not the noise. The heaviest 21–47 users per usage metric were kept — not trimmed — since they represent ConnectaTel's clearest upsell segment.
Recommendation: Design an ultra-premium tier for these power users and target Medium use customers, already the largest segment, for migration incentives toward High use/Premium.
Urban Mobility & Economic Productivity — Latin America
Determine where a development bank should invest in transport infrastructure by analyzing how urban mobility (congestion, delay) relates to economic productivity (GDP per capita, unemployment) across 15 Latin American cities.


- Data Integration — Merged TomTom traffic records with OECD city economic indicators using city and year keys
- Data Cleaning — Standardized column formats, parsed European numeric formatting, converted timestamps, filtered to 2024
- Aggregation — Grouped traffic records by city to calculate mean delay, congestion, and travel-time metrics per city-year
- Analysis — Computed a congestion-to-productivity ratio and ran correlation analysis across GDP, congestion, unemployment, and population
Python (pandas, numpy) | seaborn, matplotlib | Data wrangling & correlation analysis | Jupyter Notebook
| City | GDP/Capita | Ratio | Profile |
|---|---|---|---|
| 🇨🇴 Bogotá | $11,442 | 0.100 | Highest urgency ⭐ |
| 🇵🇪 Lima | $13,472 | 0.078 | Highest urgency ⭐ |
| 🇲🇽 Mexico City | $21,111 | 0.134 | High-scale congestion |
| 🇧🇷 São Paulo | $14,703 | 0.118 | High-scale congestion |
| 🇧🇷 Brasília | $16,251 | 0.006 | Efficient benchmark |
| 🇺🇾 Montevideo | $26,176 | 0.002 | Efficient benchmark |

The correlation matrix suggests that traffic jam is driven mainly by population size (r = 0.88), not GDP per capita (r = 0.28) as initially expected. Bogotá and Lima combine high traffic friction with lower economic output — the clearest case for investment. Mexico City and São Paulo show the highest absolute congestion, but it's scale-driven, not inefficiency. Montevideo and Brasília stand out as efficient benchmarks.

Recommendation: Prioritize transit investment in Bogotá and Lima for the highest expected economic return per dollar spent.
Risk Corruption Index (IRC in Spanish) — IMCO
Identify corruption risk in public procurement across 260+ Mexican federal institutions by evaluating compliance with three principles: competition, transparency, and rule of law.
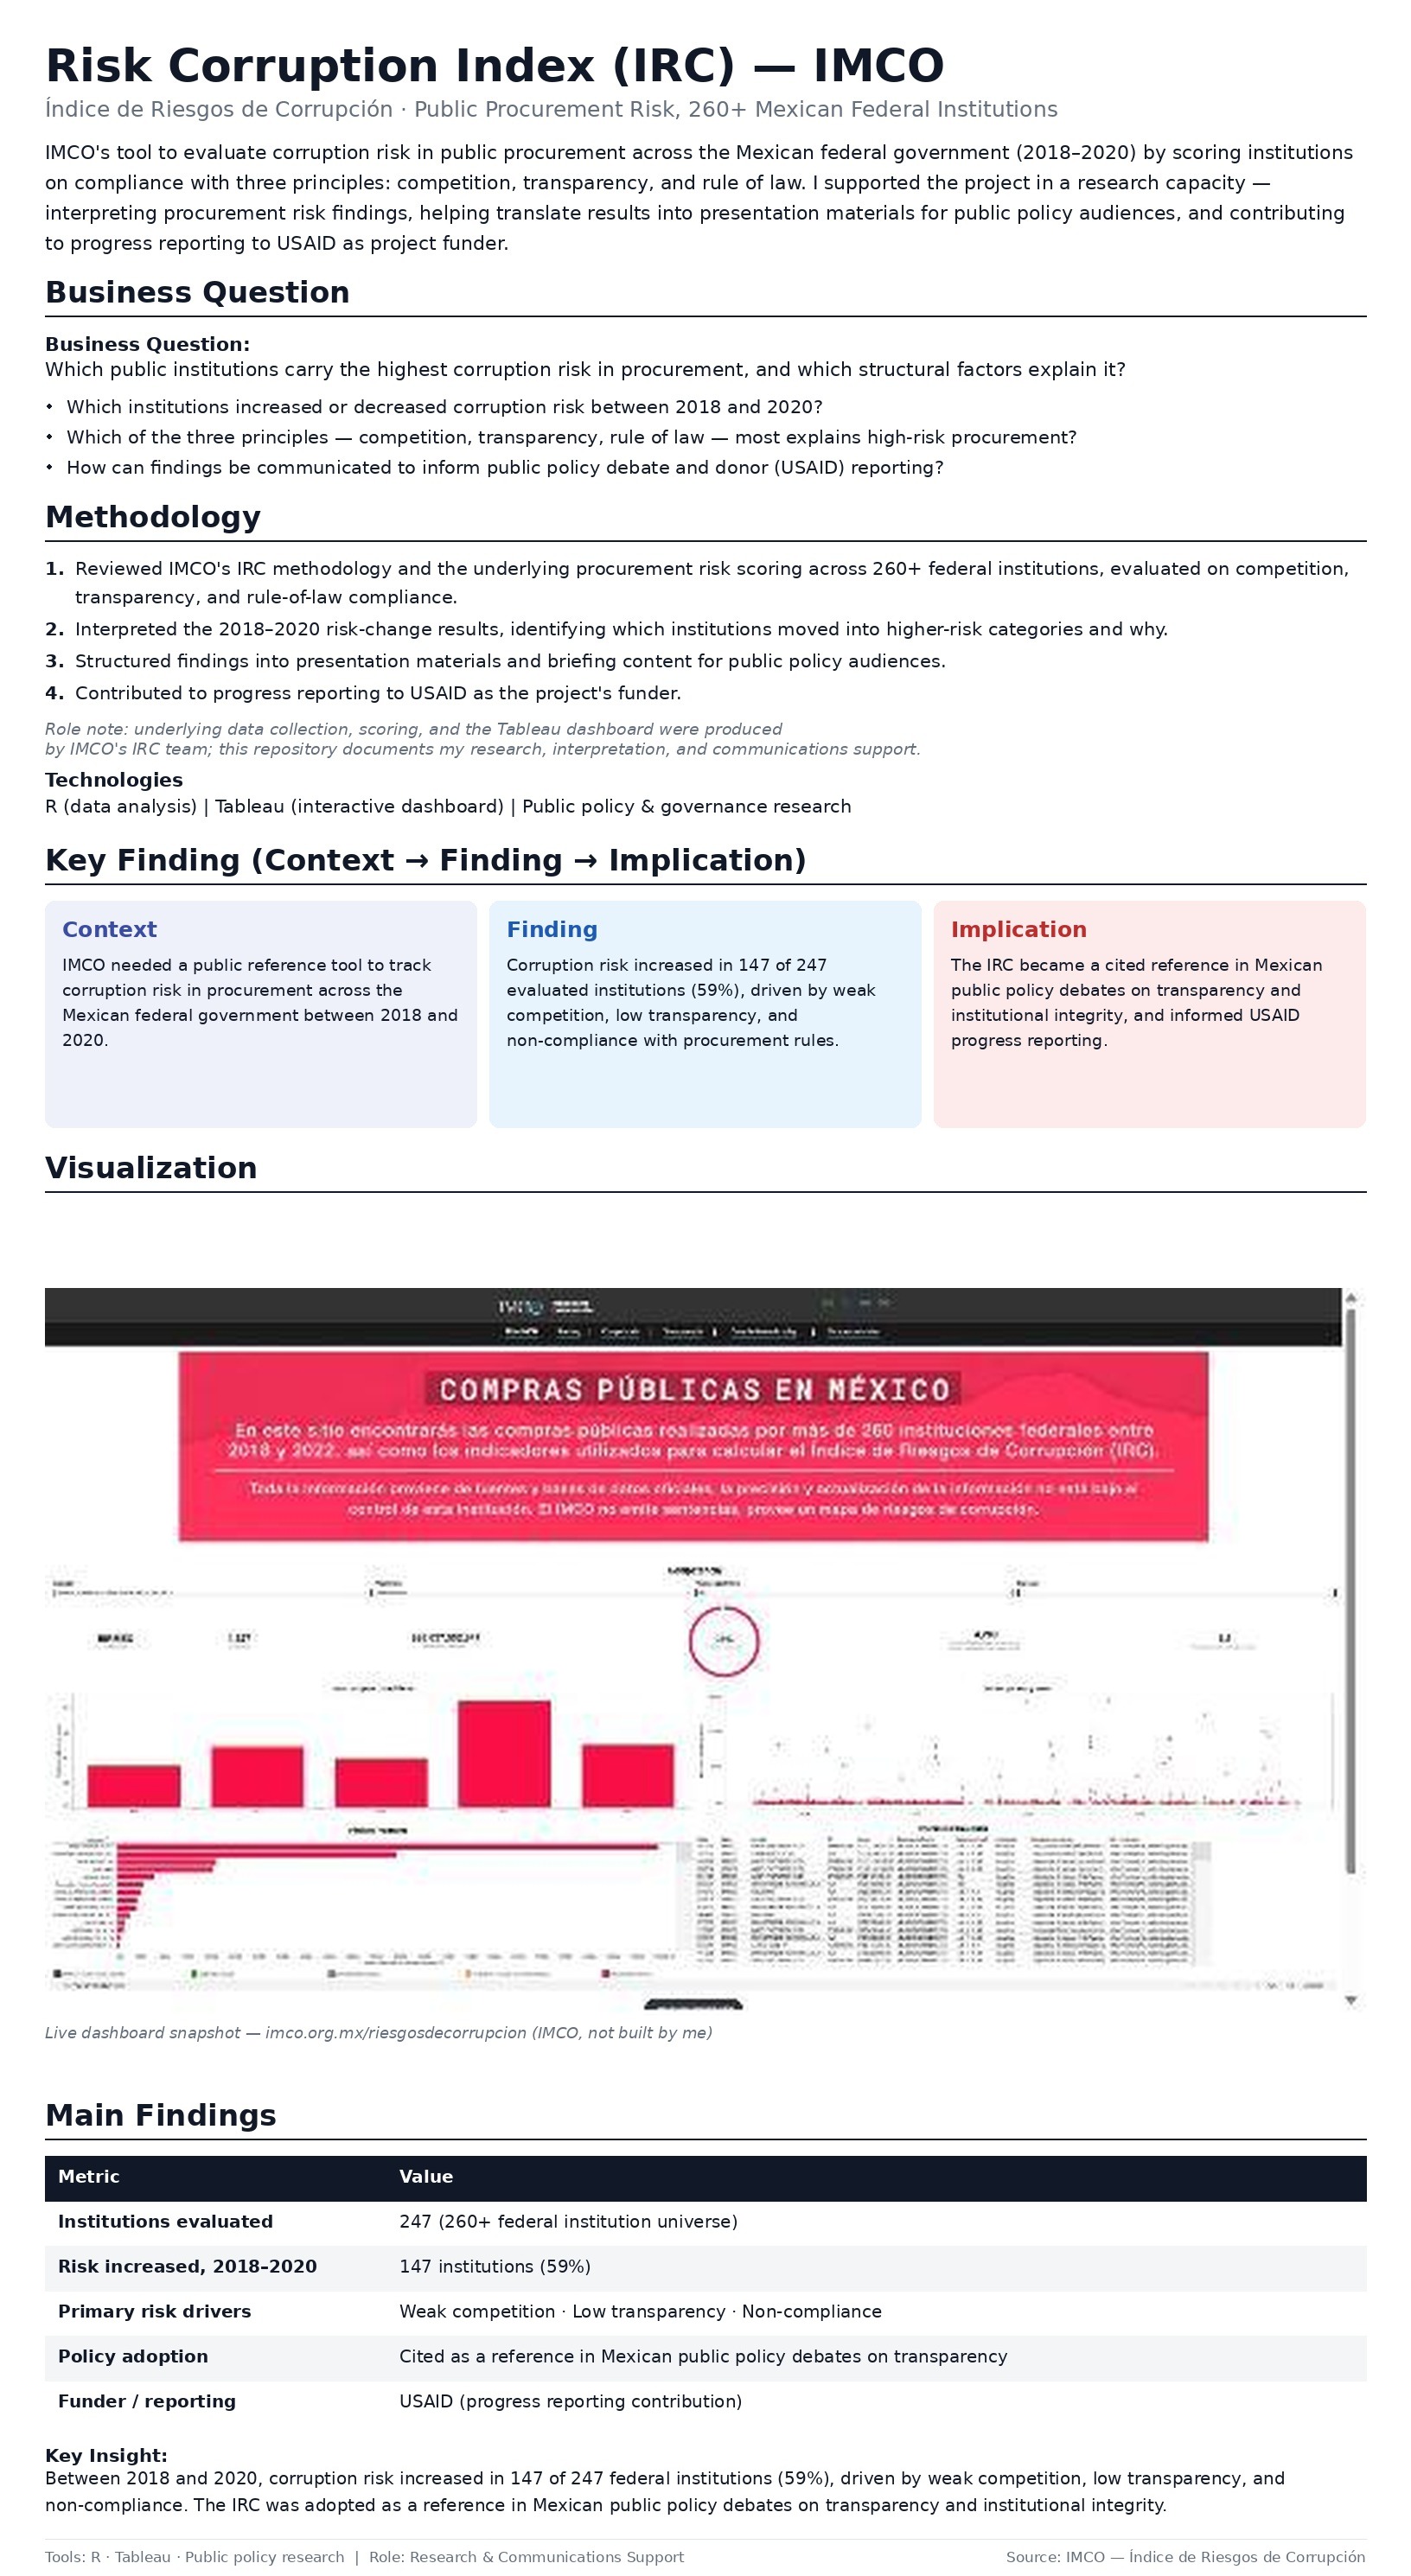
- Research Support — Supported the IRC project in a research capacity, focused on interpreting procurement risk findings
- Results Presentation — Helped translate analytical results into clear insights and presentation materials for public policy audiences
- Stakeholder Reporting — Contributed to progress reporting to USAID as project funder
R (data analysis) | Tableau (interactive dashboard) | Public policy & governance research


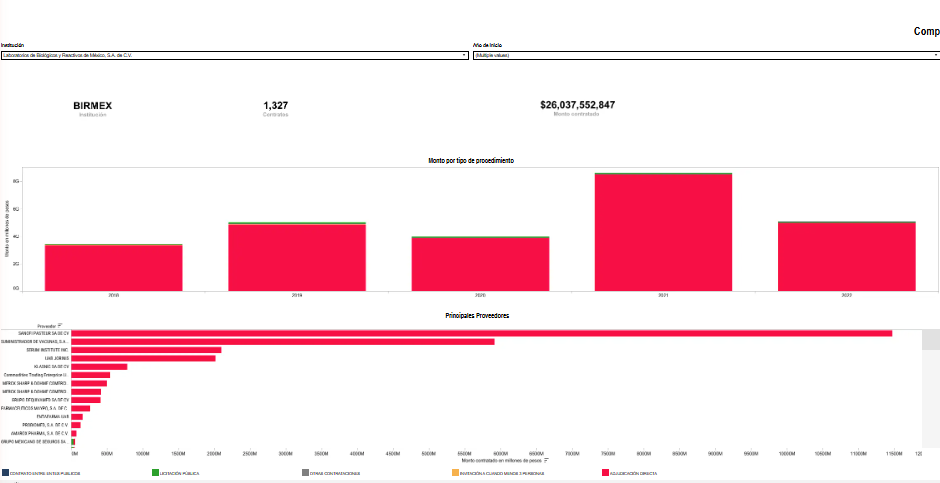
Between 2018 and 2020, corruption risk increased in 147 of 247 federal institutions (59%), driven by weak competition, low transparency, and non-compliance. The tool was adopted as a reference in Mexican public policy debates on transparency and institutional integrity.
Future of Aid 2040 — IARAN
- To analyse potential changes in the global context and aid system by 2040
- To identify concrete pathways for organisational transformation
- To develop tools and guidelines to support organisations in kick starting a transformative journey
| Metric | Value |
|---|---|
| Consultations | 50+ |
| Survey constributions | 877+ |
| From the Global South | 77% |
| From local NGOs / CSOs | 44% |
| With lived crisis experience | ~40% |
Four scenarios mapped across two axes: network cooperation vs. survival of the fittest, and multipolar blocs vs. empires and conflict.

- Trend Research — Led documentary research on global trends and drivers of change impacting the future of aid
- . Stakeholder Facilitation — Facilitated consultations in Mexico and Colombia and coordinated multiple stakeholders (strategic partners, consulted organizations) within project governance
- Multi-Phase Delivery — Contributed across the project's three phases: foundations (Causal Layered Analysis), scenarios, and transformation pathways
Strategic Foresight | Horizon Scanning | Causal Layered Analysis (CLA) | Scenario Building | Stakeholder Alignment | Project Management | Data analysis






Synthesizing 877+ voices from 50+ organizations — most from the Global South — into four scenario frameworks and an organizational toolkit for humanitarian resilience under high uncertainty.
Geopolitical Risk & Horizon Scanning
Actor mapping and strategic intelligence under conditions of high uncertainty for executive decision-making.
OSINT | Strategic Intelligence | Qualitative Risk Analysis
Tierra Incógnita: The Future of the Creative Economy — Nuevo León
Build a foresight-based framework to turn uncertainty into opportunity for Nuevo León's creative and cultural industries, facing accelerated digital disruption, AI integration, and post-pandemic pressure.


- Workshop Design & Facilitation — Designed and led strategic foresight workshops with creative-sector actors and key decision-makers
- Policy Translation — Translated the foresight exercise into an actionable public policy framework (Logical Framework Approach)
Horizon Scanning | Scenario Building | Strategic Facilitation | Logical Framework Approach
Horizon scanning report for the creative economy | 4 future scenarios for Nuevo León's creative industries | Public policy framework (Logical Framework Approach) | Published strategic policy report
🌐 Full portfolio with live project filters: maxsantana-data2strategy.github.io