FluxProxy is a scalable, containerized reverse proxy system built with Node.js and Express, managed via Docker Compose. It includes a centralized logging stack powered by Loki, Promtail, and Grafana, and uses GitHub Actions for CI (build, Compose smoke test, Trivy scan, and Docker Hub publish on main).
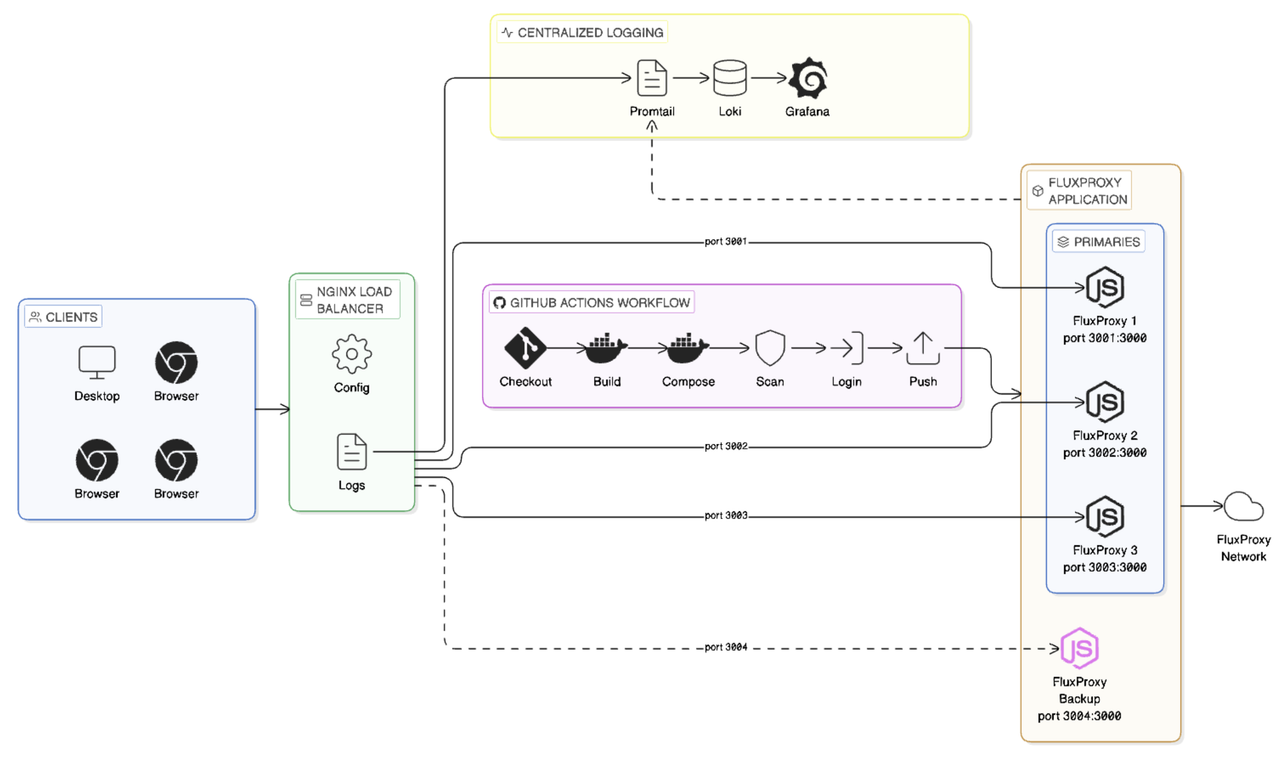
- Multiple clients (Web Browsers on Desktop and Mobile) access the system.
-
Nginx Load Balancer
- Listens on port 80
- Uses least-connections algorithm
- Has failover support for backup server
-
FluxProxy Instances (Node.js/Express):
FluxProxy 1:3001:3000FluxProxy 2:3002:3000FluxProxy 3:3003:3000Backup Proxy:3004:3000(activated only when primaries fail)
-
Environment Variables:
APP_NAME -
Live Reload: Docker Compose Watch enabled
-
Custom Docker network:
pixpro-network- Supports internal container communication
- External ports:
80,3001-3004
-
Volume Mounts:
nginx.conf: Configurationnginx/logs/: Access/Error Logs
- Promtail collects logs from Nginx
- Loki stores logs
- Grafana visualizes logs in real-time
- Clients → Nginx → Least-busy FluxProxy
- Backup traffic (dashed line) to backup server only when needed
- 🔁 Live Reload with Docker Compose Watch
- 📂 File Syncing
- ❌ Ignored Paths:
node_modules/,logs/,.git/
Workflow: .github/workflows/ci.yml (runs on pushes and pull requests to main).
- Checkout code
- Build Docker image (
fluxproxy:latest) docker compose up -d --buildand HTTP smoke test on port 80- Trivy image scan (
--exit-code 1, OS + library vulns) - On push to
mainonly (when push secrets are configured): Docker Hub login and pushfluxproxy:latest
Repository secrets (Settings → Secrets and variables → Actions):
| Secret | What to use |
|---|---|
DOCKERHUB_USERNAME |
Your Docker Hub ID — the short username in your profile URL (hub.docker.com/u/thisname). Not your email address. |
DOCKERHUB_PASSWORD |
A Docker Hub access token (recommended) or your account password. |
If these secrets are missing, CI still passes; the image is not pushed.
- Docker & Docker Compose
- Node.js
- GitHub repository with Actions enabled (for CI/CD)
docker compose up --builddocker compose -f docker-compose.logging.yml up -d --buildKeep the main app stack running as well so Nginx writes to ./logs/nginx; Promtail tails those files and ships them to Loki.
Ports: Grafana 3000, Loki API 3100 (no browser UI—use Grafana).
- Internal endpoints expose health status
- Health checks used by Docker and monitoring tools
| Component | Version |
|---|---|
| Node.js | 23-alpine |
| Express | 4.x |
| Nginx | latest |
| Docker Compose | v2+ |
| Grafana | 10.x |
| Loki | latest |
| Promtail | latest |
- Automated scanning with Trivy
- Minimal base images
- Regular dependency updates
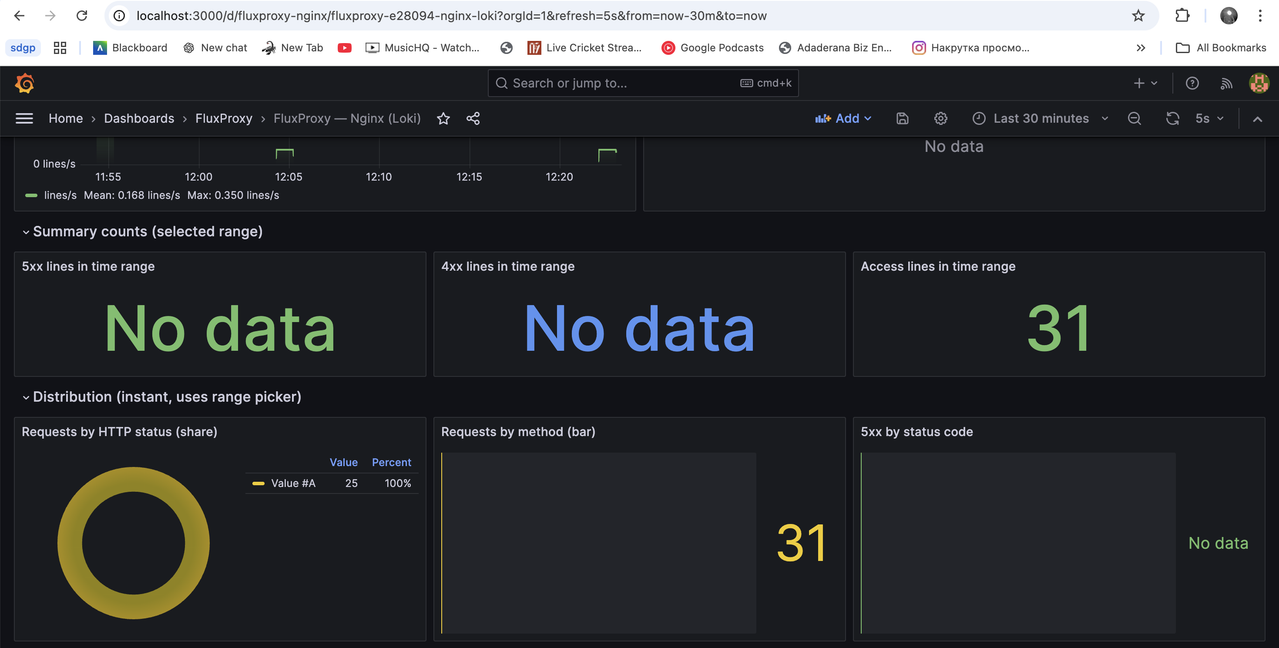
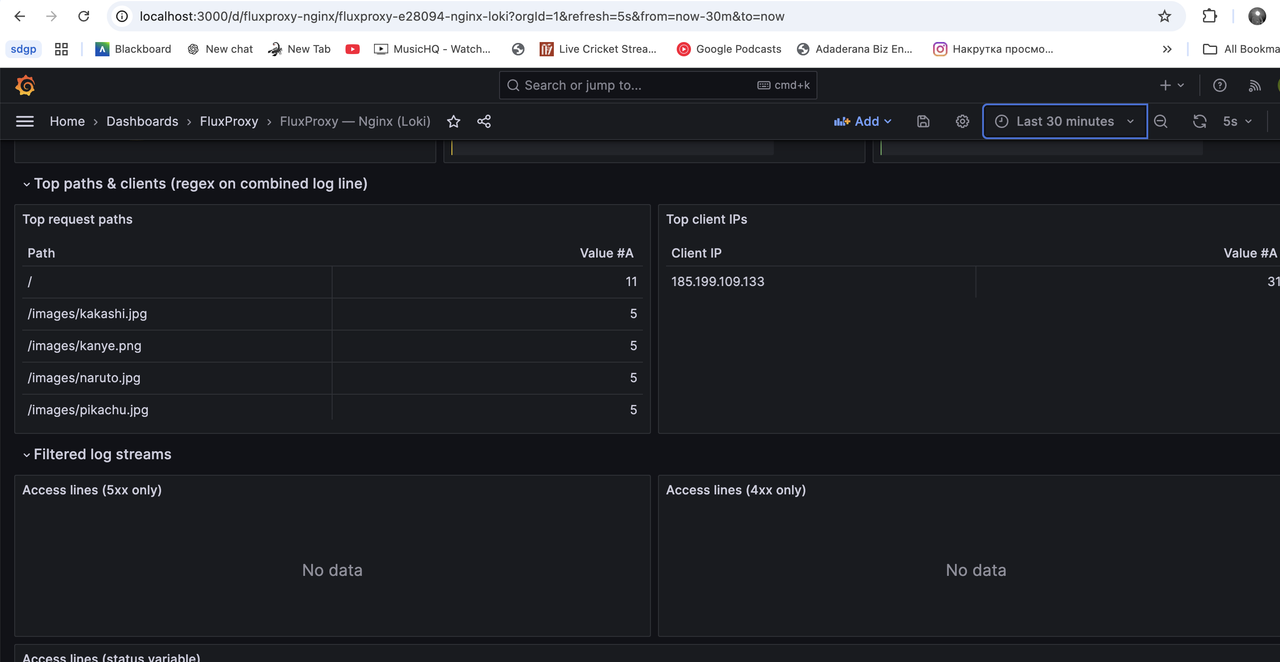
Provisioned dashboard: Dashboards → folder FluxProxy → FluxProxy — Nginx (Loki).
Data path: Nginx access/error logs (host bind mount) → Promtail → Loki → Grafana.
Open Grafana: http://localhost:3000
Default login
| Field | Value |
|---|---|
| User | admin |
| Password | admin |
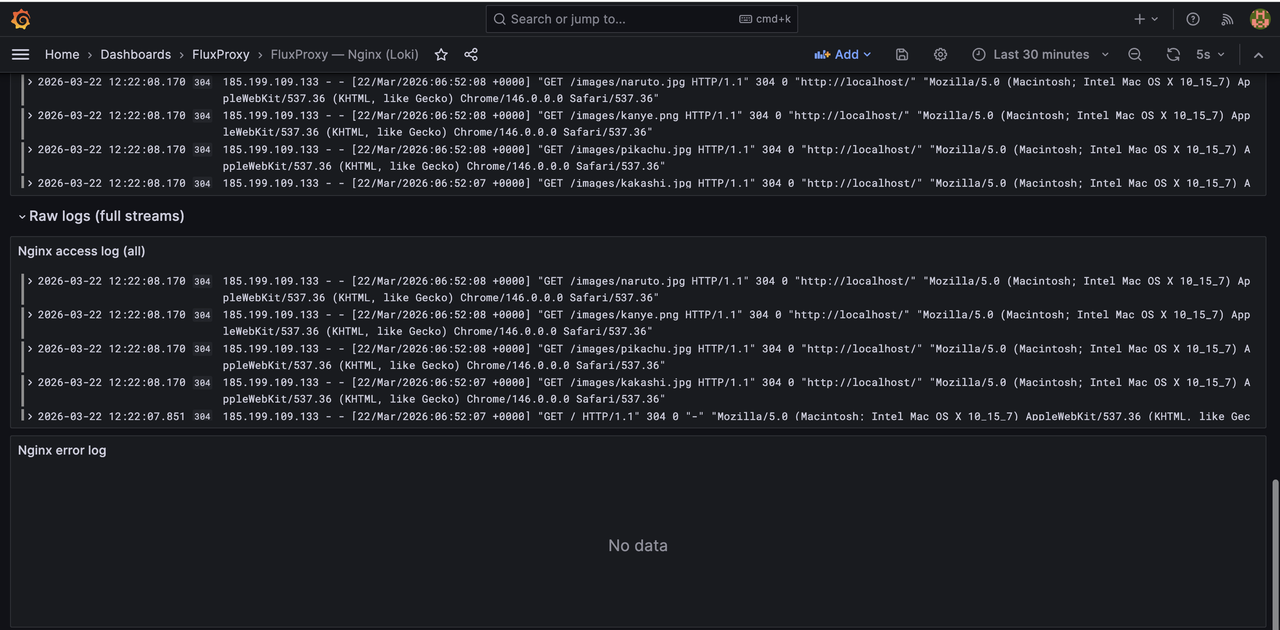
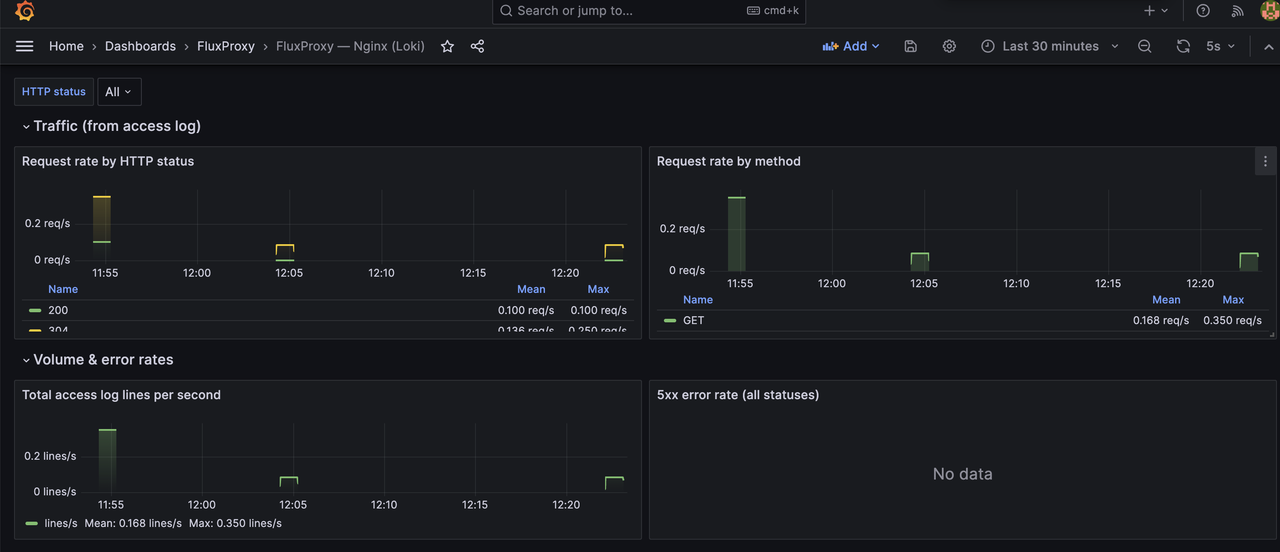
Use the time picker (e.g. Last 30 minutes) and the HTTP status variable to filter. The dashboard includes traffic rates by status and method, volume and 5xx trends, summary stats, distribution charts, top paths and client IPs (regex on the combined log line), filtered 5xx/4xx log panels, and full raw access/error streams.
Traffic and volume
Overview
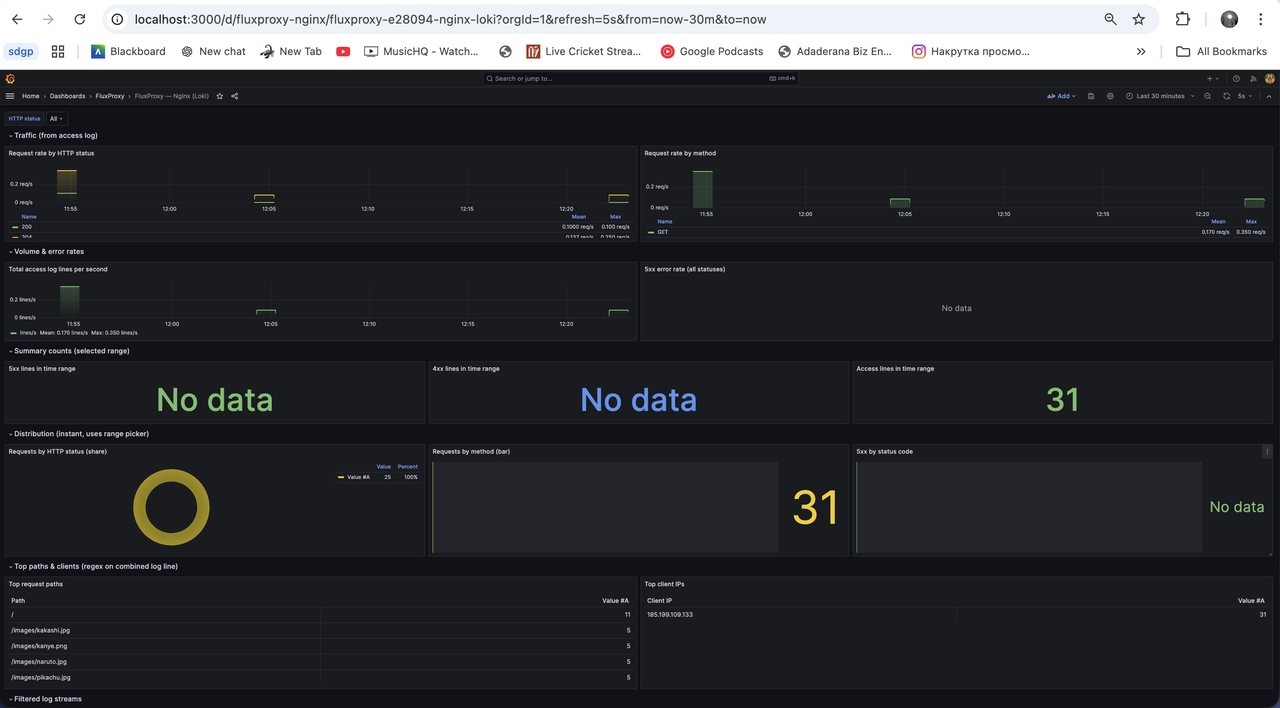
Summary and distribution
Top paths and clients
Filtered log streams
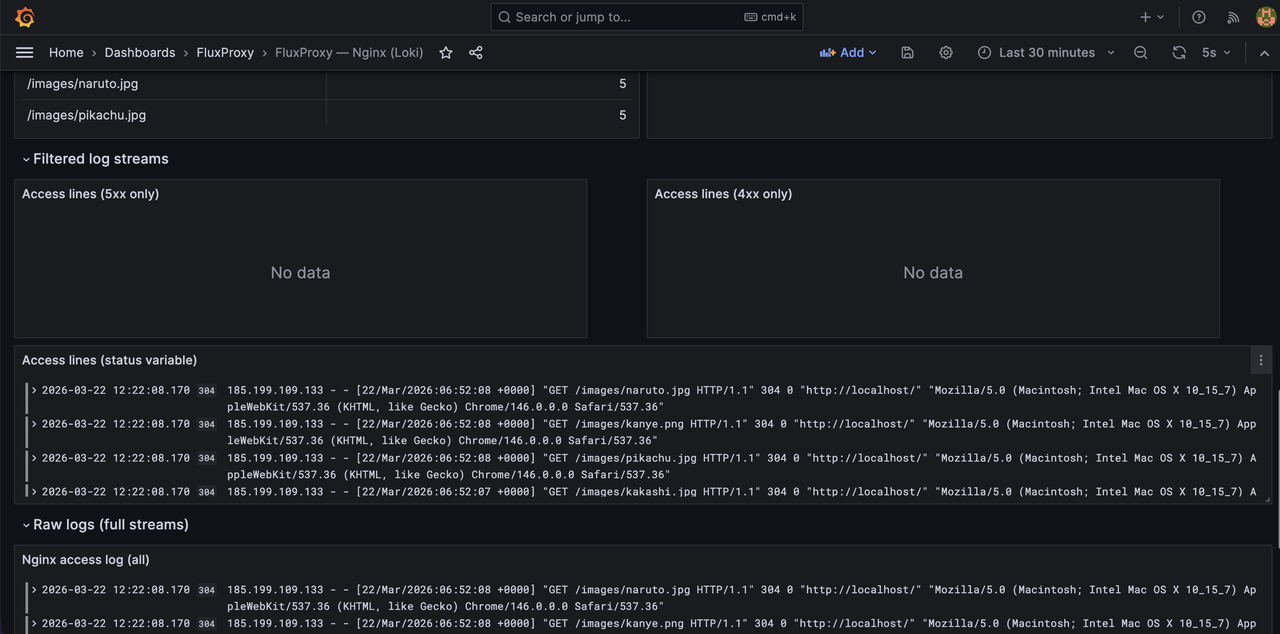
Raw Nginx logs