


A tiny 2D graphing library for Arduino_GFX — draw axes (arms), grids, labels and data series on any GFX-supported display with a few plain fields.
In both library managers it is called GFX_Graph (library names may not
start with "Arduino"); the class it gives you is called Graph.
Full API reference: reference_graph_library.md — every public field, all plot types, the configuration pattern and the known pitfalls.
There are other options such as:
- LVGL — full GUI framework with a chart widget. Very capable, but large flash/RAM footprint and a real learning curve.
- Kris Kasprzak's graphing sketches —
DrawCGraph()plus dial and bar-graph helpers. Compact and readable, but example code to copy into your sketch rather than a library, and written againstAdafruit_GFX+Adafruit_SSD1306.
Graph aims for the middle ground:
- Two files (
Graph.h/Graph.cpp), no dependencies beyond Arduino_GFX. - Works on any display Arduino_GFX supports (RGB panels, SPI TFTs, …).
- Configure a graph by setting plain member fields — no builder, no callbacks.
- 1-, 2- and 4-quadrant coordinate systems.
- Many plot styles: bars, lines, step lines, scatter, markers.
- Overlay several data series on one grid.
- Lightweight "data-only" redraw for fast live updates.
Use Graph when you want a small, readable, self-contained plotter. Use LVGL if you need a complete UI toolkit.
- Arduino_GFX installed and already working on your display.
Get Arduino_GFX running first. Graph draws through an
Arduino_GFX *pointer and does nothing display-specific. If Arduino_GFX cannot yet draw a line or fill the screen on your panel, fix that before adding Graph — otherwise you are debugging two things at once.
PlatformIO — add to platformio.ini:
lib_deps =
    hazowagit/GFX_Graph
    https://github.com/moononournation/Arduino_GFX.git
Or straight from GitHub, without the registry:
https://github.com/hazowa/Arduino_GFX_Graph.git
Arduino IDE — Sketch → Include Library → Manage Libraries…, search for GFX_Graph. Install GFX Library for Arduino as well if you have not already. Alternatively Add .ZIP Library… with a ZIP of this repository.
Manual — copy src/Graph.h and src/Graph.cpp next to your sketch.
Then:
#include <Arduino_GFX_Library.h>
#include "Graph.h"
Arduino_GFX must already be initialised so that a valid Arduino_GFX *gfx
exists before you construct a Graph.
Complete, buildable version: examples/Minimal/Minimal.ino.
#include <Arduino_GFX_Library.h>
#include "Graph.h"

extern Arduino_GFX *gfx;          // your initialised Arduino_GFX instance
Graph g(gfx);

// All field assignments live here so setup()/loop() stay readable.
void configure_graph() {
    // Geometry (pixels) — origin + arm lengths
    g.x_start = 40;  g.y_start = 230;
    g.x_length_right = 190; g.x_length_left = 0;   // 1 quadrant
    g.y_length_up    = 190; g.y_length_down = 0;
    g.x_width = 1;   g.y_width = 1;

    // Ticks and grid
    g.x_ticks_major = 5; g.x_tick_minor = 0;
    g.y_ticks_major = 6; g.y_tick_minor = 0;
    g.grid_major_color = GRAPH_DARK_GREY;
    g.grid_minor_color = GRAPH_DARK_GREY;
    g.x_color = GRAPH_WHITE; g.y_color = GRAPH_WHITE;

    // Labels (pipe-separated, one segment per major tick)
    g.x_label = "0|2|4|6|8";
    g.y_label = "10|8|6|4|2|0";
    g.x_label_pos = UNDER; g.y_label_pos = LEFT;
    g.x_label_color = GRAPH_WHITE; g.y_label_color = GRAPH_WHITE;
    g.label_back = GRAPH_BLACK; g.label_shadow = GRAPH_BLACK;
    g.x_label_size = 1; g.y_label_size = 1;

    // Data range (mapped onto the arms)
    g.x_axis_max_val = 8; g.x_axis_min_val = 0;
    g.y_axis_max_val = 10; g.y_axis_min_val = 0;

    // Plot style
    g.plot_color = GRAPH_GREEN;
    g.plot_type  = 210;   // line + node markers
    g.plot_size  = 3;
    g.plot_clip  = true;
    g.axis_area_color = GRAPH_BLACK;
}

void setup() {
    Serial.begin(115200);
    delay(500);                    // give the serial monitor time to attach
    Serial.println("Graph minimal sketch start");

    configure_graph();
}

void loop() {
    static float phase = 0.0f;     // shifts the wave so each frame differs

    g.draw_graph();                       // draw frame + prepare scaling
    g.has_prev = false;                   // start a fresh line series
    for (float x = 0; x <= 8; x += 0.4f)
        g.draw_plot(x, 5.0f + 4.0f * sinf(x + phase));

    phase += 0.3f;
    delay(200);
}The graph is placed by an origin (x_start, y_start) and four arm
lengths in pixels. Data values map onto those arms.
Those pixels follow the Arduino_GFX convention: the display's (0, 0) is its
top-left corner and y grows downward. So y_start is the graph's
bottom edge, and its top edge sits at y_start - y_length_up. Graph flips its
own Y axis on top of that, which is why positive data values still plot upward.

Figure 2 in reference_graph_library.md maps the label, range and plot fields onto the same graph.
| Layout | Arms set | Origin sits at | Typical use |
|---|---|---|---|
| 1 quadrant | right + up | bottom-left | positive X and Y only |
| 2 quadrants | left + right + up | bottom-centre | ± X, positive Y |
| 4 quadrants | all four | centre | ± X and ± Y |
Scaling rule (X and Y behave the same):
- With a left/down arm, the origin is the zero point; values scale symmetrically outward.
- Without a left/down arm, the origin is the minimum value
(
x_axis_min_val/y_axis_min_val), so a range that does not start at 0 works too.
For an asymmetric range (
|min| != max) the arm lengths must be proportional to the data range for data and grid to line up.
Set g.plot_type before drawing. plot_size is the marker/line thickness.
| Type | Style |
|---|---|
0 |
Move the text cursor only (no drawing) |
100 |
Vertical bar from the value down to the X axis |
101 |
Bar with a rounded (circle) top |
200 |
Line / step line between consecutive points |
210 |
Line + filled node marker |
212 |
Line + node marker, redrawn cleanly over itself |
300 |
Single pixel |
301 |
Filled dot |
310 |
Filled dot with a hollow centre (ring marker) |
320 |
Filled dot with a crosshair (target marker) |
Line types (200 / 210 / 212) connect each point to the previous one. Set
g.has_prev = false before a new series so the first point is not joined to a
leftover point from an earlier run.
Draw the frame once, then reuse it with the data-only redraw
draw_graph(false) — it skips clear/grid/axis/label and only recomputes the
scaling. Cheap enough for live updates.
g.draw_graph();                    // full frame + series 1 scale
g.has_prev = false;
for (...) g.draw_plot(x, y1);      // series 1

g.y_axis_max_val = 50;             // series 2 uses a different scale
g.plot_color = GRAPH_RED;
g.draw_graph(false);               // recompute scale, keep the existing grid
g.has_prev = false;
for (...) g.draw_plot(x, y2);      // series 2 over the same grid
draw_graph(false) is also the fast path for redrawing changing data every
frame without repainting the static grid and labels each time.
g.plot_type = 200;
g.draw_graph();
g.has_prev = false;                // required, or point 0 joins a stale point
for (int hour = 0; hour < 24; hour++)
g.draw_plot(hour, price[hour]);RGB565 constants are provided with a GRAPH_ prefix (collision-free):
GRAPH_BLACK, GRAPH_WHITE, GRAPH_RED, GRAPH_GREEN, GRAPH_BLUE,
GRAPH_CYAN, GRAPH_MAGENTA, GRAPH_YELLOW, plus GRAPH_WARM_WHITE,
GRAPH_ROZ, GRAPH_LIGHT_GREY, GRAPH_MID_GREY, GRAPH_DARK_GREY.
Short aliases (WHITE, RED, …) are also defined, but only when Arduino_GFX
has not already defined them. Any RGB565 uint16_t works too.
The exact values are listed in reference_graph_library.md.
| Example | Board | Build with |
|---|---|---|
| Minimal | any (generic SPI TFT shown) | Arduino IDE or PlatformIO |
| Guition_ESP32-4848S040 | Guition ESP32-4848S040 (ST7701S, 480×480 RGB) | PlatformIO — open that folder |
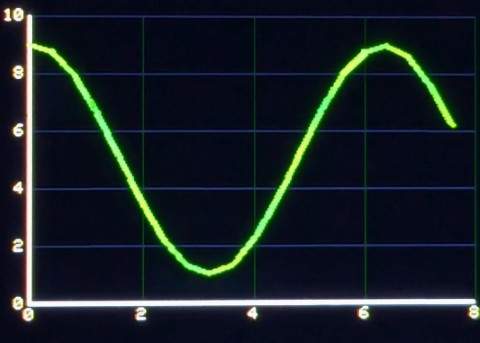
Minimal draws a scrolling sine wave; only the Arduino_GFX setup block is board-specific, so swap it for the one that already works on your panel.
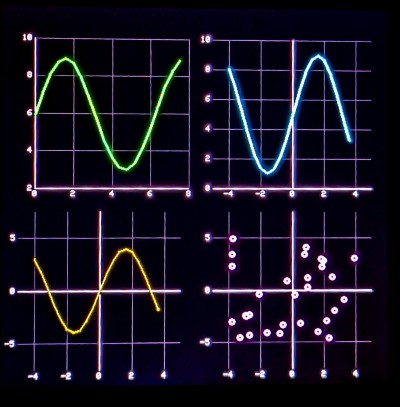
Guition_ESP32-4848S040 is a complete four-graph demo (1, 2 and 4 quadrants,
line and scatter) with its own platformio.ini, board definition and display
layer. See its README for the
panel-specific notes — bounce buffer, canvas, TE command — that took real
debugging to find.
src/                      Graph.h + Graph.cpp — the library
examples/Minimal/         board-independent starter sketch
examples/Guition_.../     full PlatformIO demo for the ESP32-4848S040
docs/                     parameter figures used by the docs
reference_graph_library.md  full API reference
MIT — see LICENSE.