
Lightweight, high-performance JavaScript charting library for building interactive financial charts — Forex charts, cryptocurrency charts, and stock market charts with real-time data, 60+ technical indicators, and advanced drawing tools. A powerful open-source TradingView alternative for web developers and brokers.



Build professional trading charts for your website, trading platform, or broker application with just a few lines of code. No frameworks required — works with vanilla JavaScript, React, Vue, Angular, or any web stack.
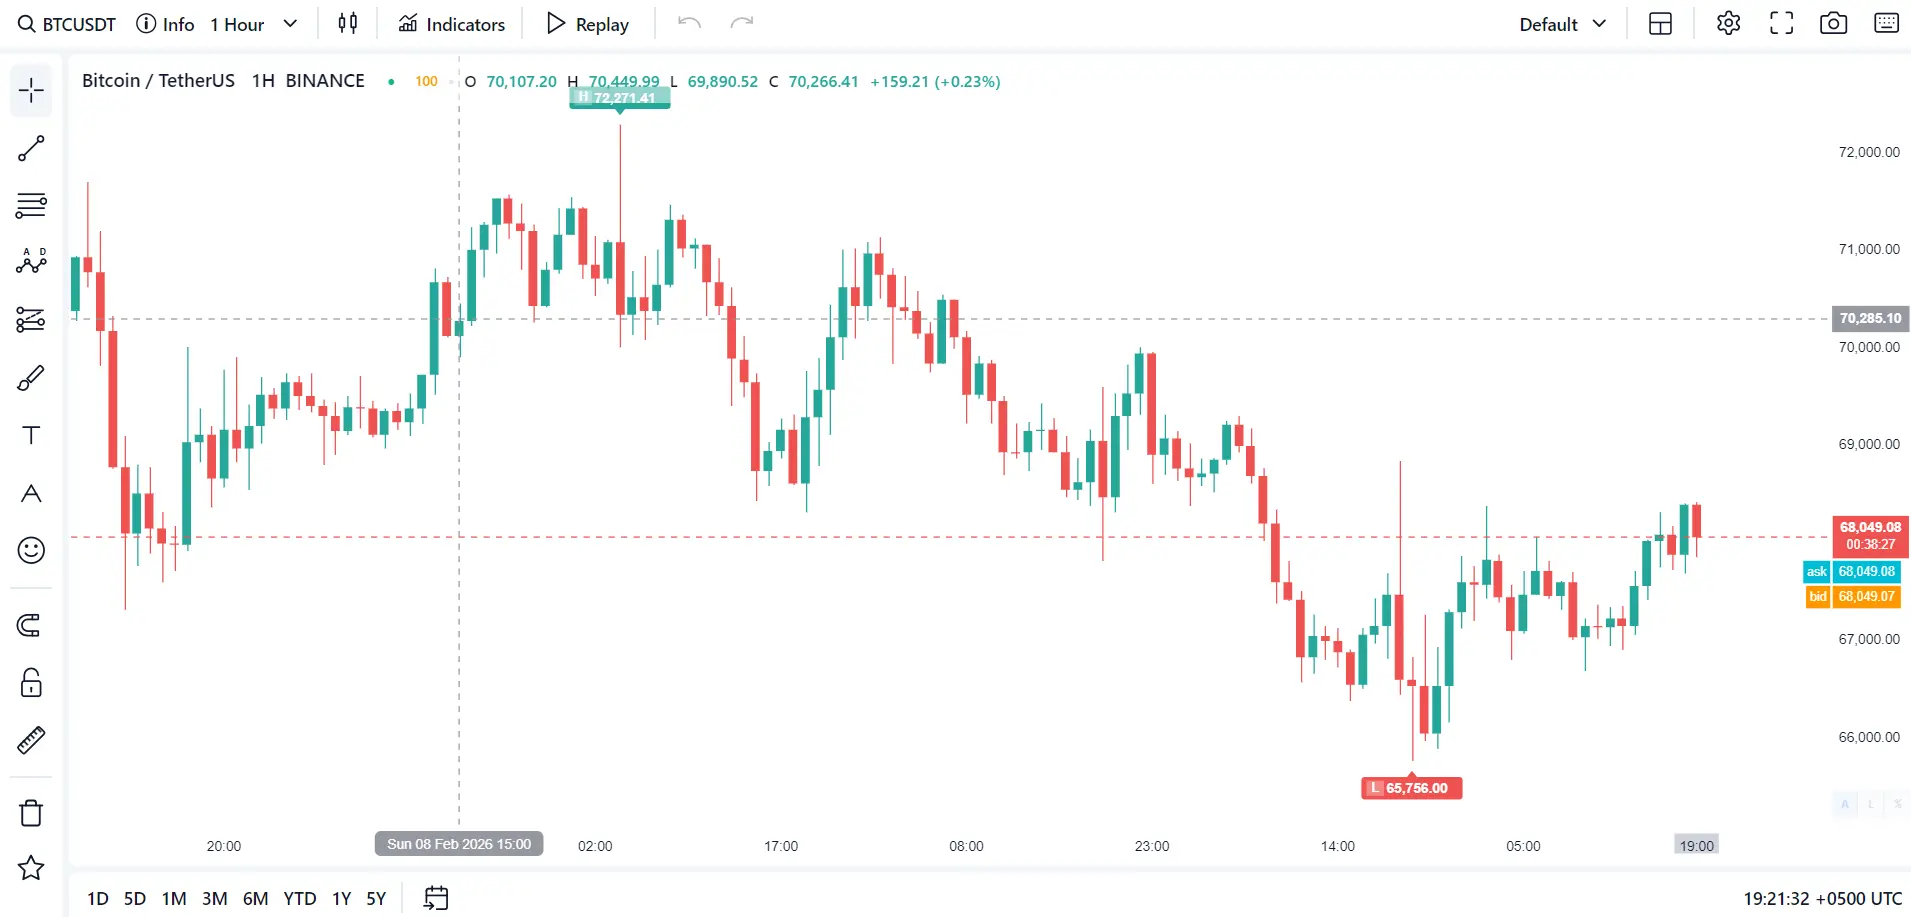
Click the screenshot to open the live demo
- Live Demo: fcsapi.com/chart/index.html
- Documentation: fcsapi.com/document/chart-api
- Get a free API key: fcsapi.com/dashboard
| Feature | FCS Chart | Other Libraries |
|---|---|---|
| Real-time WebSocket data | Yes | Often paid/separate |
| 60+ Technical indicators | Built-in | Limited or plugin-based |
| Drawing tools (Fibonacci, Trendlines) | Built-in | Rarely included |
| Forex + Crypto + Stocks | All-in-one | Usually single market |
| Mobile responsive | Yes | Varies |
| Bundle size | Lightweight | Often heavy |
| Pricing | Free / MIT License | Often commercial |
- Real-time Trading Charts — Live candlestick price updates via WebSocket connection
- Multi-Market Data — Forex currency pairs, cryptocurrency (Bitcoin, Ethereum, etc.), and stock market data (NASDAQ, NYSE)
- 60+ Technical Analysis Indicators — RSI, MACD, Bollinger Bands, EMA, SMA, Ichimoku Cloud, Stochastic, ATR, VWAP, and more
- Professional Drawing Tools — Trendlines, Fibonacci retracement, horizontal lines, shapes, text annotations, and XABCD patterns
- 9 Chart Types — Candlestick, OHLC bars, Line, Area, Heikin-Ashi, Hollow candles, High-Low, Volume candles, Renko
- Dark & Light Themes — Customizable color schemes for any UI
- Responsive Design — Optimized for desktop, tablet, and mobile browsers
- Multi-Chart Layouts — Display multiple charts side by side with different symbols or timeframes
- Chart Replay Mode — Replay historical price action for backtesting strategies
- Screenshot & Export — Export charts as images for reports and sharing
- Broker Integration — Add TP/SL/Entry price lines programmatically via API
- Broker Spread (Ask/Bid) — Show your own dealable ask/bid: add a spread or markup per symbol, and change it live with
setAskBid() - Secure Login Without Exposing Your Key — Use a domain-locked public key, or a short-lived JWT created on your server, so your access key never appears in the browser
- Indicators & Markers from Code — Add or remove indicators and Buy/Sell markers with
addIndicator()andaddMarker() - Symbol Search Control — Limit the search window to the tabs, exchanges and symbols you choose, and hide the exchange name if you want
- Undo/Redo Support — Full undo/redo for all drawing operations (Ctrl+Z, Ctrl+Y)
- Keyboard Shortcuts — Professional keyboard shortcut support
- Timezone Support — Local, UTC, or custom timezone offsets
- No Dependencies — Pure JavaScript, no jQuery or external frameworks required
See the live chart in action: FCS API Chart Demo
The fastest way to get started — add two lines to your HTML:
<!-- FCS Chart CSS -->
<link rel="stylesheet" href="https://cdn.jsdelivr.net/gh/fcsapi/chart-js@latest/src/fcsapi-chart.css">

<!-- FCS Chart JavaScript -->
<script src="https://cdn.jsdelivr.net/gh/fcsapi/chart-js@latest/src/fcsapi-chart.js"></script>| Version | Status |
|---|---|
@latest |
Recommended — always up to date |
@4.1.1 |
Current stable release |
@4.0.4 |
Previous stable |
@4.0.3 |
Previous stable |
<!-- Pin to version 4.1.1 -->
<link rel="stylesheet" href="https://cdn.jsdelivr.net/gh/fcsapi/[email protected]/src/fcsapi-chart.css">
<script src="https://cdn.jsdelivr.net/gh/fcsapi/[email protected]/src/fcsapi-chart.js"></script>
Tip: the chart loads its lazy modules (
src/chunks/) from the same address asfcsapi-chart.js, so a pinned version always loads matching files.
git clone https://github.com/fcsapi/chart-js.git
cd chart-js<link rel="stylesheet" href="src/fcsapi-chart.css">
<script src="src/fcsapi-chart.js"></script>Get a chart running in under 2 minutes:
<!DOCTYPE html>
<html>
<head>
    <title>My Trading Chart</title>
    <link rel="stylesheet" href="https://cdn.jsdelivr.net/gh/fcsapi/chart-js@latest/src/fcsapi-chart.css">
    <style>
        #fcs_chartparent { width: 100%; height: 100vh; }
    </style>
</head>
<body>
    <div id="fcs_chartparent">
        <div id="fcs_chart"></div>
    </div>

    <script src="https://cdn.jsdelivr.net/gh/fcsapi/chart-js@latest/src/fcsapi-chart.js"></script>
    <script>
        const chart = new FCSAPIChart({
            container: document.getElementById('fcs_chart'),
            parentid: 'fcs_chartparent',
            // accessKey: 'YOUR_API_KEY',   // optional: without a key the free chart (300 candles) is used
            symbol: 'BINANCE:BTCUSDT',
            period: '1H'
        });
    </script>
</body>
</html>| Example | Description |
|---|---|
| Simple Chart | Minimal setup — just 3 required settings to render a chart |
| Full Configuration | Complete trading chart with all configuration options |
Only 2 settings are required to create a chart:
const chart = new FCSAPIChart({
    container: document.getElementById('fcs_chart'),  // Chart container element
    parentid: 'fcs_chartparent',                      // Parent container ID
});
With no key at all the free chart is used (300 candles). To load more data, add one of the login options below.
| Option | What goes in the page | When to use |
|---|---|---|
| Access key | accessKey |
Simplest. The key is visible in the browser's network requests |
| Public key + Allowed Domains | publicKey only |
No backend needed. The chart works only on the websites you allow in Dashboard > Security |
| Public key + access key | publicKey and accessKey |
Requests are signed with the public key, so the access key does not appear in the network tab. It is still in your page source, so use a JWT if the key must stay secret |
| JWT from your server | jwt_token only |
Best security. No key at all in the page, the token expires |
const container = document.getElementById('fcs_chart');
const parentid = 'fcs_chartparent';

// 1) Access key
new FCSAPIChart({ container, parentid, accessKey: 'YOUR_ACCESS_KEY' });

// 2) Public key (allow your domain in Dashboard > Security > Allowed Domains)
new FCSAPIChart({ container, parentid, publicKey: 'YOUR_PUBLIC_KEY' });

// 3) JWT created on your server (no accessKey and no publicKey in the page)
const chart = new FCSAPIChart({ container, parentid, jwt_token: 'JWT_FROM_YOUR_SERVER' });
How the JWT works:
- Your server (never the browser) creates the token:
https://api-v4.fcsapi.com/forex/jwt_token?access_key=YOUR_ACCESS_KEY&expiry=300. Add&domain=yoursite.comto lock the token to your website. - Pass
response.jwt_tokento the chart asjwt_token. The chart sends onlyjwt_token=<jwt>with every API request. - The token expires after
response.expires_inseconds. Get a new one before that and give it to the chart:
chart.updateJWTtoken('new_jwt');

// Example: refresh the token shortly before it expires
async function refreshJWT() {
    const r = await (await fetch('/your-backend/jwt-token')).json();   // your backend returns the answer of ...jwt_token?access_key=...
    if (!r.status) return console.error(r.msg);
    chart.updateJWTtoken(r.response.jwt_token);
    setTimeout(refreshJWT, Math.max(10, r.response.expires_in - 30) * 1000);
}
refreshJWT();
A page on an Allowed Domain can also call https://api-v4.fcsapi.com/forex/jwt_token?public_key=YOUR_PUBLIC_KEY directly (the expiry then comes from Dashboard > Security). Full details are in the chart documentation.
Extra API parameters: url_params: { abc: 1 } adds &abc=1 to every API request the chart makes.
{
    symbol: 'BINANCE:BTCUSDT',      // Symbol to display (format: EXCHANGE:SYMBOL)
    period: '1H',                    // Timeframe: 1m, 5m, 15m, 30m, 1h, 4h, 1D, 1W, 1M
    length: 600,                     // Number of candles to load
    theme: 'dark',                   // 'dark' | 'light'
    defaultChartType: 'candlestick', // candlestick | bars | line | area | hollow | heikin-ashi
}{
enableSocket: true, // Enable live price updates
socketApiKey: 'YOUR_SOCKET_KEY', // WebSocket API key
}{
displayMode: 'normal', // 'normal' = full UI | 'chartonly' = embeddable chart only
enableSidebar: true, // Left sidebar with drawing tools
enableToolbar: true, // Top toolbar with controls
enableRangeSelector: true, // Bottom time range selector
}{
enableSearch: true, // Symbol search bar
enableIndicators: true, // Technical indicators panel
enableMultiChart: true, // Multi-chart layout selector
enableReplay: true, // Historical replay mode
enableCapture: true, // Screenshot & image export
enableUndoRedo: true, // Undo/Redo (Ctrl+Z, Ctrl+Y)
enableTemplates: true, // Save/load chart templates
enableSettings: true, // Settings panel
}{
enableContextMenu: true, // Right-click context menu
enableDrawingTools: true, // Drawing & annotation tools
enableGrid: false, // Grid lines
enableCrosshair: true, // Crosshair on hover
enablePriceLine: true, // Current price line
enableAskBidLines: false, // Ask/Bid price lines
enableHighLowLabels: true, // High/Low price labels
autoScale: true, // Auto-scale price axis
logScale: false, // Logarithmic price scale
}{
askLabelColor: '#00bcd4', // Ask price label color
bidLabelColor: '#ff9800', // Bid price label color
lastPriceLabelColor: null, // Last price label (null = candle color)
}{
timezone: 'local', // 'local' | 'UTC' | '+05:00' | '-08:00'
}The askBid option changes the ask/bid lines and labels so a broker can show their own dealable quote. The candles are never changed. Omit it to show the raw feed quote.
askBid: { base: 'feed', spreadPips: 10 }     // ask +10 pips, bid -10 pips on top of the real market quote
askBid: { base: 'close', spreadPips: 10 }    // ignore the feed quote, build a 10-pip spread around the close
askBid: { base: 'feed', spreadPercent: 0.01 } // add 1 percent to each side
askBid: { base: 'close', spreadPips: 0 }     // no spread: ask and bid on one line

// 15 pips on BTCUSDT, 10 pips on every other symbol
askBid: {
    base: 'close',
    spreadPips: 10,
    perSymbol: { 'BINANCE:BTCUSDT': { spreadPips: 15 } }
}| Field | Description |
|---|---|
base |
'feed' = add your spread to the market ask/bid, 'close' = build the quote around the candle close, 'raw' = no adjustment |
spreadPips / spreadPercent / spread |
Widens each side (pips, fraction of price, or absolute price units) |
markupPips / markupPercent / markup |
Moves both sides together (rare) |
perSymbol |
Per-symbol rules that override the top-level values, keyed by EXCHANGE:SYMBOL |
Change it at runtime with chart.setAskBid({ base: 'close', spreadPips: 10 }), or pass null to go back to the raw quote.
{
    hideExchangeAllPlaces: false,    // true = hide the exchange name everywhere (search, OHLC bar, info panel)
    hideExchangeInOHLC: false,       // true = hide the exchange name only in the OHLC bar

    // Choose what users can find in the symbol search window (null = no limit)
    searchModalTabs: { fav: 'Fav', forex: 'Forex', crypto: 'Crypto', stock: 'Stocks' },
    searchAllowSymbols: ['BINANCE:BTCUSDT', 'ONA:EURUSD'],
    searchExcludeSymbols: ['BINANCE:DOGEUSDT'],
    searchAllowExchanges: { crypto: ['BINANCE'], stock: { US: ['NASDAQ'], PK: '*' } }
}
Tab keys: fav, all, forex, crypto, commodity, stock, dr, fund, futures, indices, dex.
chart.setSymbol('NASDAQ:AAPL');      // Switch to Apple stock
chart.setSymbol('FX:EURUSD');        // Switch to EUR/USD forex pair
chart.setSymbol('BINANCE:ETHUSDT');  // Switch to Ethereum
chart.setPeriod('4h'); // Change to 4-hour timeframechart.setTheme('light'); // Switch to light theme
chart.setChartType('line'); // Switch to line chart
chart.setChartType('candlestick'); // Switch to candlestick chart// Add an indicator: type is the indicator name, the other fields are its inputs
const id = await chart.addIndicator({ type: 'Sma', len: 20 }); // returns the indicator id, or null for an unknown type
await chart.addIndicator({ type: 'Rsi', length: 14 });
await chart.addIndicator({ type: 'Macd', fast_length: 12, slow_length: 26, signal_length: 9 });
chart.removeIndicator(id);
// Put a Buy / Sell marker on a candle (timestamp in seconds, or a candle index)
chart.addMarker({ timestamp: 1791388800, price: 85200, type: 'buy', text: 'Order 1', id: 'order-1' });
chart.removeMarker('order-1');
chart.clearMarkers();Marker type examples: buy, sell, long, short, entry, exit, tp, sl, arrow-up, arrow-down, star, flag.
chart.setAskBid({ base: 'close', spreadPips: 10 });  // change the ask/bid spread live (null = raw feed quote)
chart.updateJWTtoken('new_jwt'); // give the chart a fresh JWT (only when you use jwt_token)const imageData = chart.exportImage(); // Returns base64 image stringchart.resize(); // Recalculate after container resize
chart.destroy(); // Remove chart and free memoryProgrammatically add Take Profit, Stop Loss, and entry price lines:
// Add Take Profit line
const tpLine = await chart.addHorizontalLine({
    price: 45000,
    color: '#4caf50',
    label: 'TP',
    style: 'dashed'
});

// Add Stop Loss line
const slLine = await chart.addHorizontalLine({
    price: 42000,
    color: '#f44336',
    label: 'SL',
    style: 'dashed'
});

// Update line price (e.g., drag TP/SL)
chart.updateHorizontalLine(tpLine, { price: 46000 });

// Remove a specific line
chart.removeHorizontalLine(tpLine);

// Get all horizontal lines
const lines = chart.getHorizontalLines();

// Clear all lines
chart.clearHorizontalLines();| Market | Format | Examples |
|---|---|---|
| Forex | FX:PAIR |
FX:EURUSD, FX:GBPUSD, FX:USDJPY, FX:AUDUSD |
| Crypto | EXCHANGE:PAIR |
BINANCE:BTCUSDT, BINANCE:ETHUSDT, COINBASE:ETHUSD |
| Stocks | EXCHANGE:SYMBOL |
NASDAQ:AAPL, NASDAQ:TSLA, NASDAQ:GOOGL, NYSE:MSFT |
| Period | Description |
|---|---|
1m |
1 Minute chart |
5m |
5 Minute chart |
15m |
15 Minute chart |
30m |
30 Minute chart |
1h |
1 Hour chart |
4h |
4 Hour chart |
1D |
Daily chart |
1W |
Weekly chart |
1M |
Monthly chart |
| Type | Description |
|---|---|
candlestick |
Japanese candlestick chart |
bars |
OHLC bar chart |
line |
Line chart |
area |
Area / Mountain chart |
hollow |
Hollow candlestick chart |
heikin-ashi |
Heikin-Ashi smoothed candles |
high-low |
High-Low range chart |
volume-candles |
Volume-weighted candle chart |
renko |
Renko chart (price movement bricks) |
Full list of built-in technical analysis indicators for trading:
Trend Indicators: SMA (Simple Moving Average), EMA (Exponential Moving Average), WMA (Weighted Moving Average), DEMA (Double EMA), TEMA (Triple EMA), Bollinger Bands, Keltner Channels, Ichimoku Cloud, Parabolic SAR, SuperTrend, ADX (Average Directional Index)
Oscillators: RSI (Relative Strength Index), Stochastic Oscillator, MACD (Moving Average Convergence Divergence), CCI (Commodity Channel Index), Williams %R, ROC (Rate of Change), Awesome Oscillator, CMO (Chande Momentum Oscillator)
Volume Indicators: OBV (On Balance Volume), Volume, VWAP (Volume Weighted Average Price), Chaikin Money Flow, MFI (Money Flow Index), Accumulation/Distribution Line
Volatility Indicators: ATR (Average True Range), Standard Deviation, Bollinger Bandwidth
Professional-grade drawing and annotation tools:
- Lines — Trendlines, horizontal lines, vertical lines, ray lines
- Fibonacci — Fibonacci retracement, extension, fan, arcs, time zones
- Patterns — XABCD harmonic patterns
- Shapes — Rectangle, ellipse, triangle
- Text & Labels — Text annotations, price labels, callouts
- Measurement — Price range, date range, price & date range
- Trading Platforms — Embed professional charts in your web-based trading platform
- Broker Websites — Add interactive financial charts with TP/SL line support
- Crypto Dashboards — Real-time Bitcoin, Ethereum, and altcoin price charts
- Forex Portals — Live currency pair charts with technical analysis tools
- Stock Market Apps — Interactive stock charts with indicators for financial websites
- Financial News Sites — Embed responsive charts alongside market news
- Education & Research — Teaching technical analysis with interactive chart tools
- Portfolio Trackers — Visualize asset performance with historical charts
chart-js/
├── src/
│   ├── fcsapi-chart.js              # Main chart library
│   ├── fcsapi-chart.css             # Chart styles
│   └── chunks/                       # Lazy-loaded modules (loaded on demand)
│       ├── indicator.technicals.*.js # Technical indicator calculations
│       ├── indicator.patterns.*.js   # Pattern recognition modules
│       └── indicator.signals.*.js    # Signal generation modules
├── examples/
│   ├── simple.html                   # Simple example (minimal setup)
│   └── index.html                    # Full configuration example
├── README.md
└── LICENSE
- Visit FCS API
- Create a free account
- Copy your API key from the dashboard
- Start building charts!
- FCS API Documentation — Full API reference
- Chart Library Guide — Chart-specific documentation
- FCS API Dashboard — Manage your API keys
| Browser | Version |
|---|---|
| Chrome | 60+ |
| Firefox | 55+ |
| Safari | 12+ |
| Edge | 79+ |
| Mobile Chrome | 60+ |
| Mobile Safari | 12+ |
- Email: [email protected]
- Website: fcsapi.com
- Issues: GitHub Issues
javascript chart library, financial chart, trading chart, stock chart, forex chart, crypto chart, candlestick chart, technical analysis, real-time chart, websocket chart, TradingView alternative, open source chart, OHLC chart, bitcoin chart, market data visualization, broker chart widget, embeddable chart, lightweight chart, charting library, interactive chart
MIT License — see LICENSE file for details.
Free to use in personal and commercial projects.