Skip to content

Integration of perftest CI with standardised benchmarks - #6514

Merged
hkaiser merged 8 commits into
TheHPXProject:masterfrom
vrnimje:cdash_perftest_bench
Oct 22, 2026
Merged

hkaiser merged 8 commits into
TheHPXProject:masterfrom
vrnimje:cdash_perftest_bench

Conversation

@vrnimje

@vrnimje vrnimje commented Jun 21, 2024

Copy link
Copy Markdown
Contributor

Proposed Changes

  • Improved the perftest CI with CDash integration
  • Added separate cmake function for adding performance tests with specific options for benchmarking purposes, which also creates a custom target for generating the plots

Any background context you want to provide?

Extension to #6448
Sample run on CDash: https://my.cdash.org/builds/2589647

@jenkins-cscs

Copy link
Copy Markdown

Can one of the admins verify this patch?

@codacy-production

codacy-production Bot commented Jun 21, 2024 •

Copy link
Copy Markdown

Coverage summary from Codacy

See diff coverage on Codacy

Coverage variation Diff coverage
✅ -0.06% ✅ 81.75%
Coverage variation details
Coverable lines Covered lines Coverage
Common ancestor commit (17bbc63) 222489 189245 85.06%
Head commit (6072f1b) 196545 (-25944) 167059 (-22186) 85.00% (-0.06%)

Coverage variation is the difference between the coverage for the head and common ancestor commits of the pull request branch: <coverage of head commit> - <coverage of common ancestor commit>

Diff coverage details
Coverable lines Covered lines Diff coverage
Pull request (#6514) 263 215 81.75%

Diff coverage is the percentage of lines that are covered by tests out of the coverable lines that the pull request added or modified: <covered lines added or modified>/<coverable lines added or modified> * 100%

See your quality gate settings    Change summary preferences


🚀 Don’t miss a bit, follow what’s new on Codacy.

Codacy stopped sending the deprecated coverage status on June 5th, 2024. Learn more

@hkaiser hkaiser added type: enhancement category: CI category: perftests Python performance tests regressions labels Jun 23, 2024
@vrnimje

vrnimje commented Jul 11, 2024

Copy link
Copy Markdown
Contributor Author
Performance test report

small_vector_benchmark

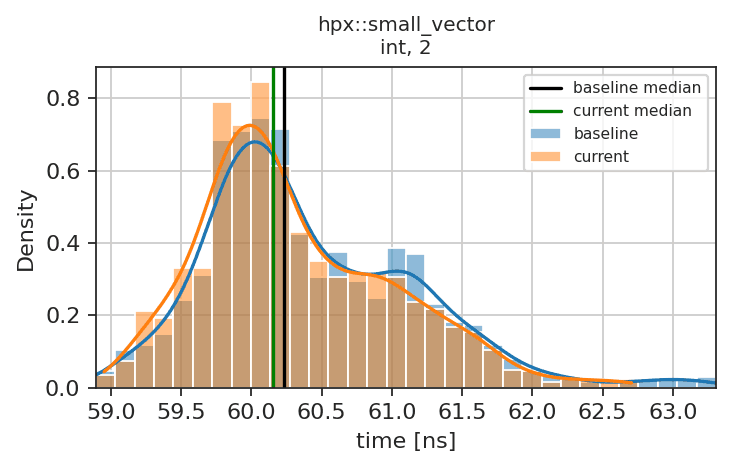
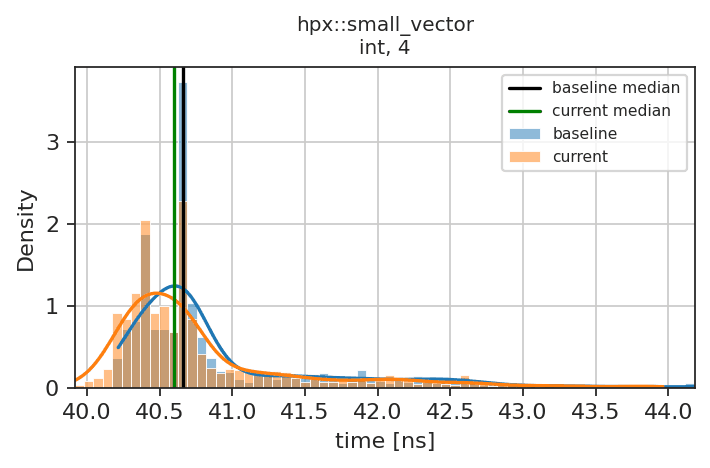
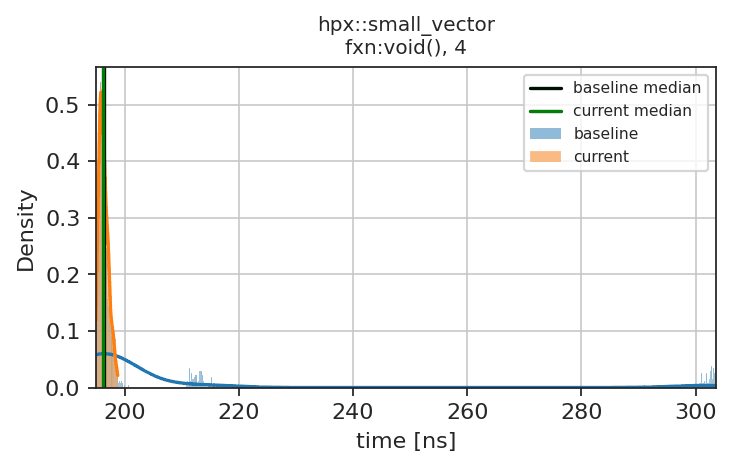
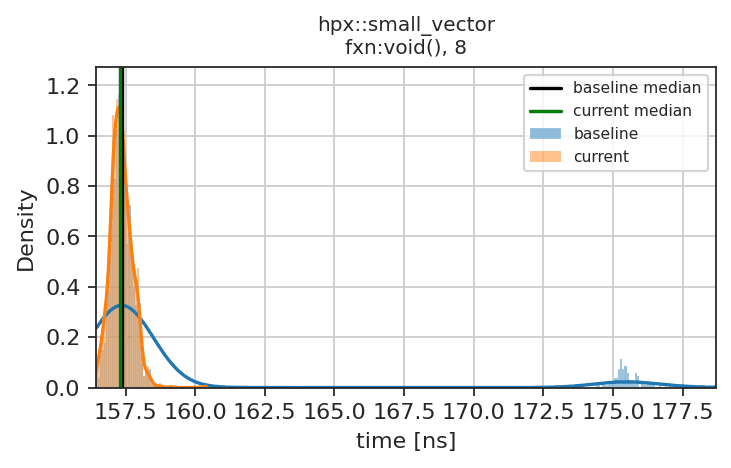
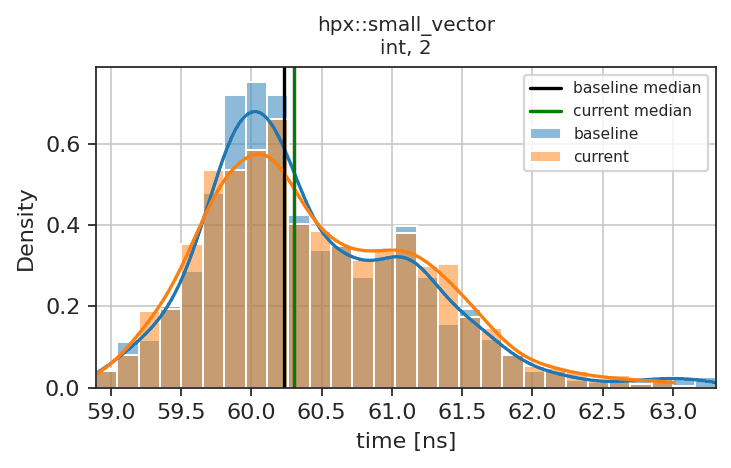
  1. hpx::small_vector, <fxn<void()>, 2>: Performance is better by 0.46 % (KS-stat: 0.9583333333333334)

stream_report

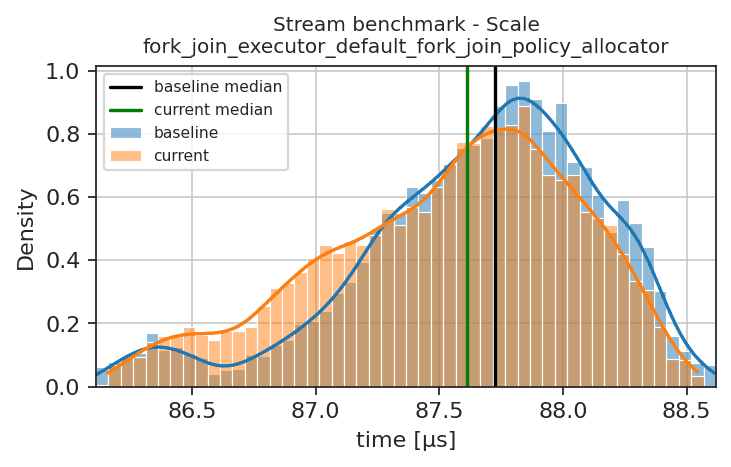
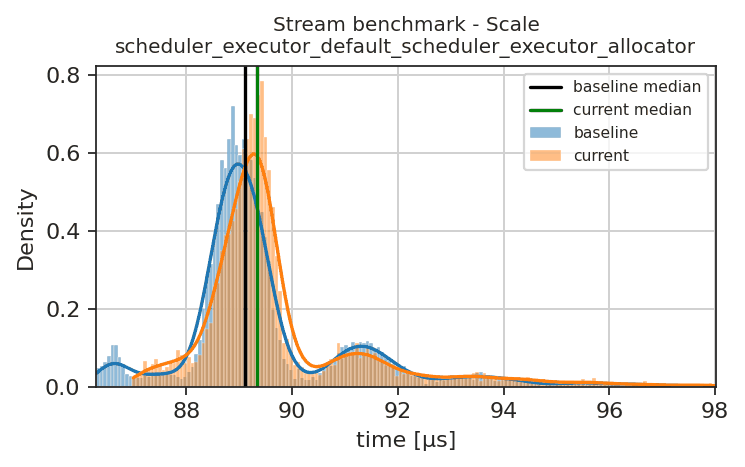
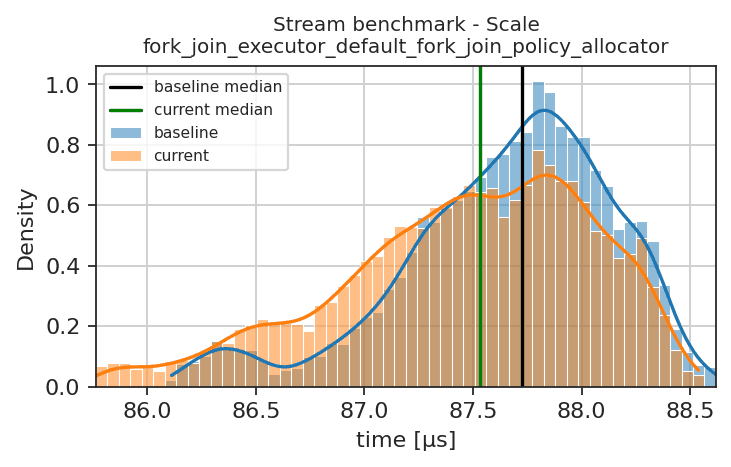
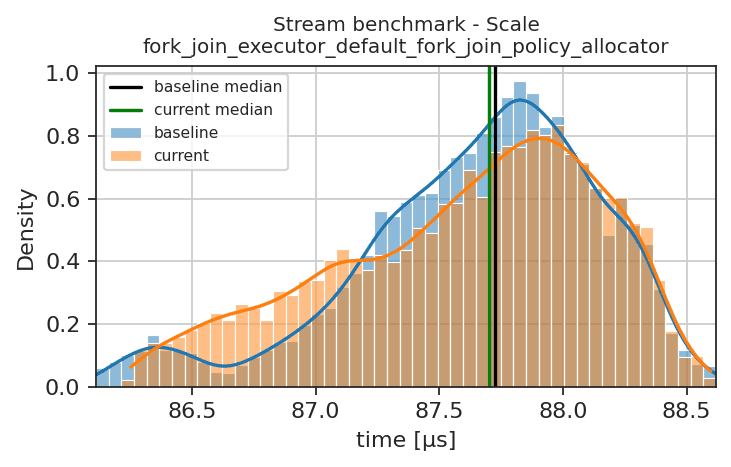
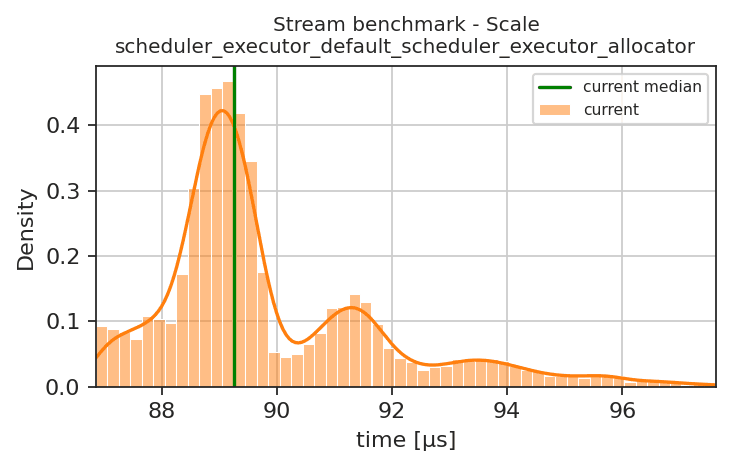
  1. Stream benchmark - Scale, fork_join_executor_default_fork_join_policy_allocator: Performance is better by 12.69 % (KS-stat: 0.9583333333333334)
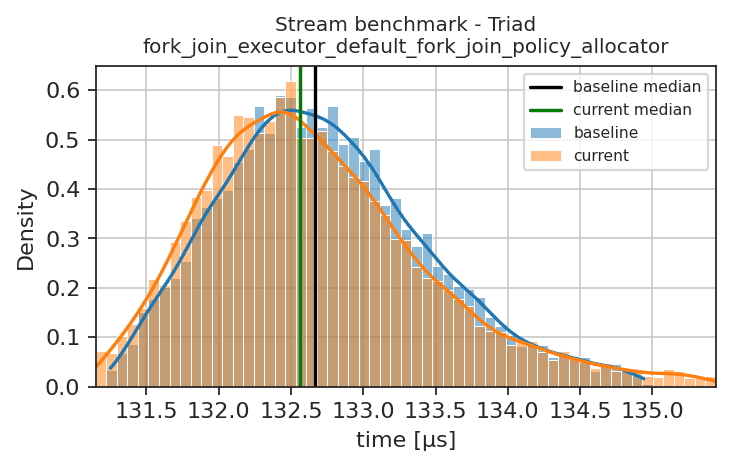
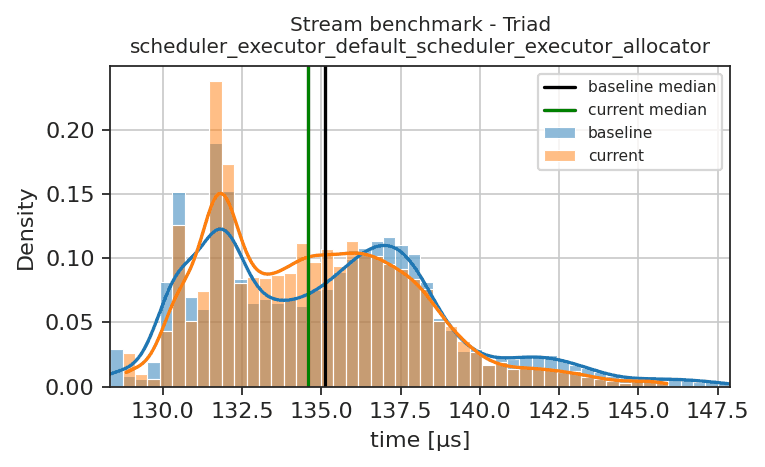
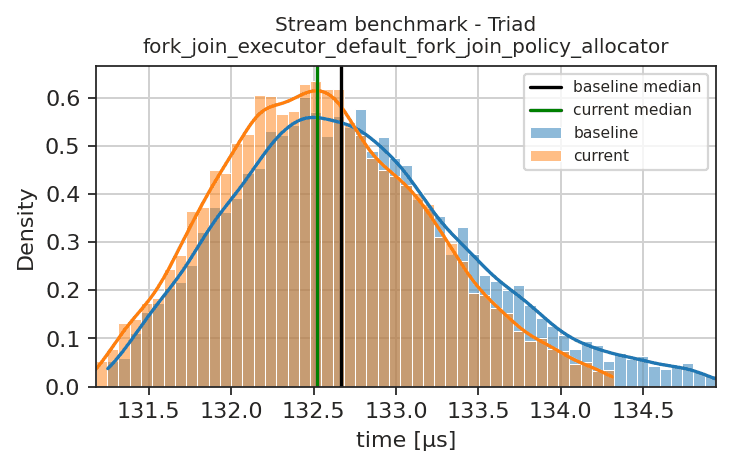
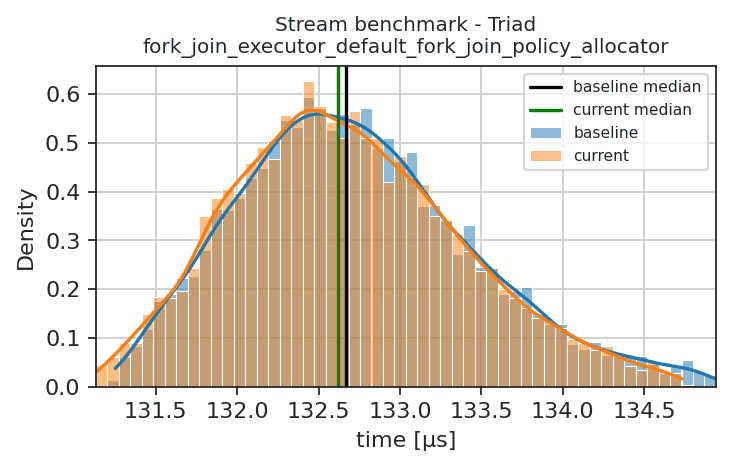
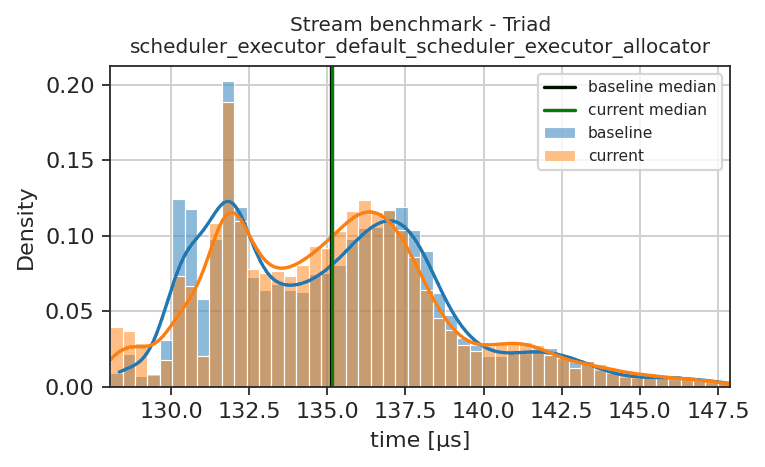
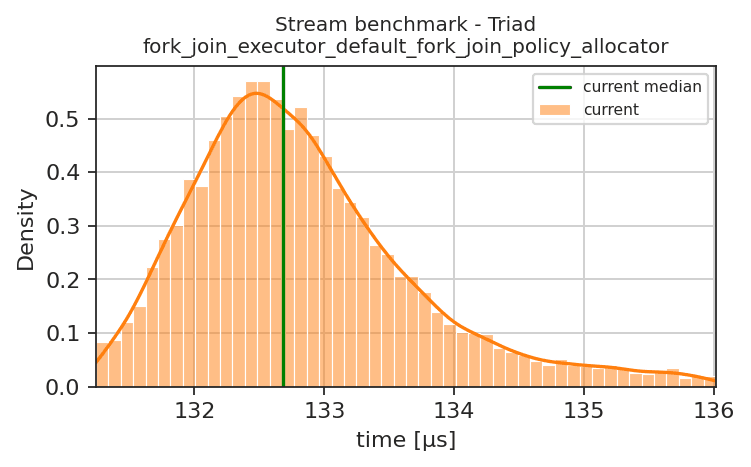
  2. Stream benchmark - Triad, fork_join_executor_default_fork_join_policy_allocator: Performance is better by 3.25 % (KS-stat: 0.875)
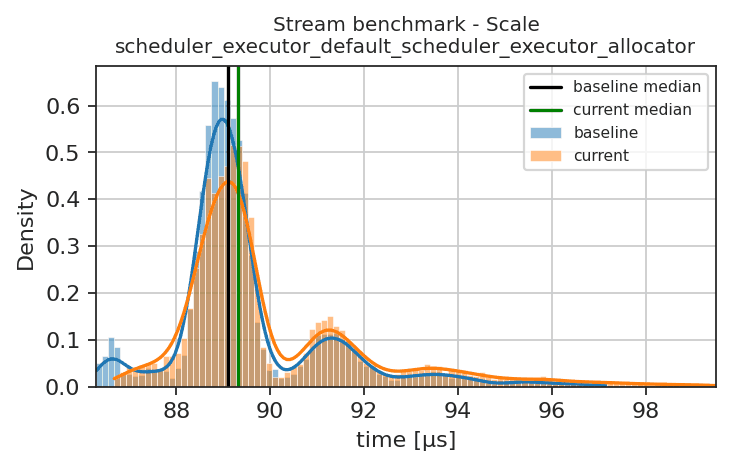
  3. Stream benchmark - Scale, scheduler_executor_default_scheduler_executor_allocator: Performance is better by 18.40 % (KS-stat: 1.0)
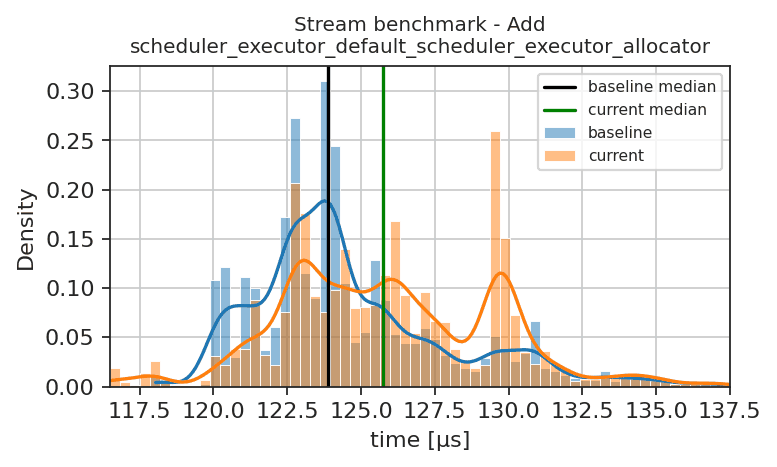
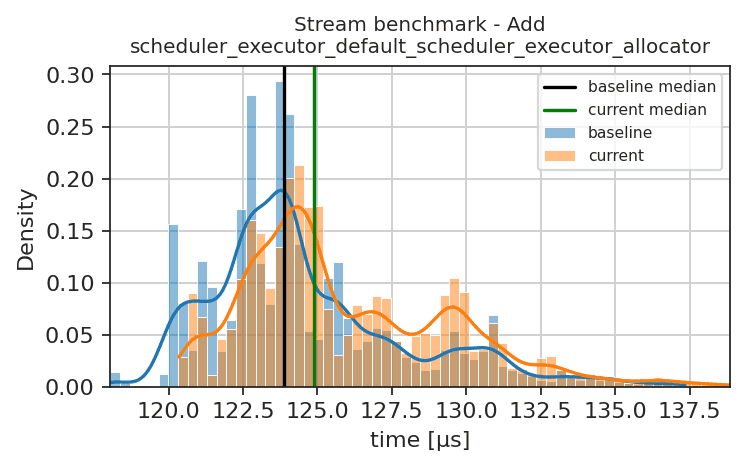
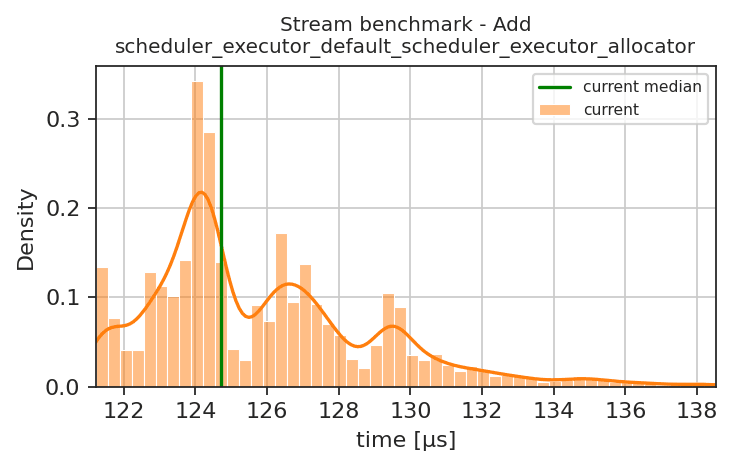
  4. Stream benchmark - Add, scheduler_executor_default_scheduler_executor_allocator: Performance is better by 10.84 % (KS-stat: 0.7916666666666666)

foreach_report

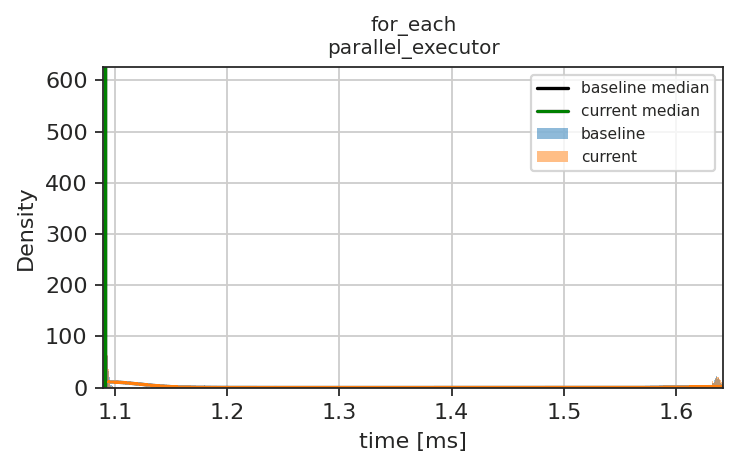
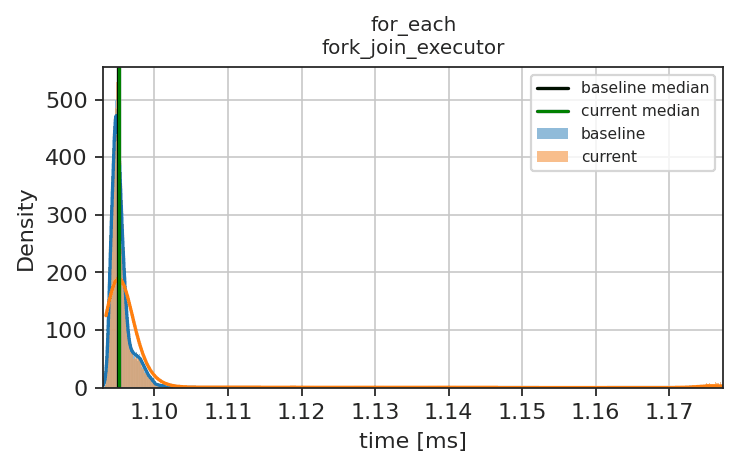
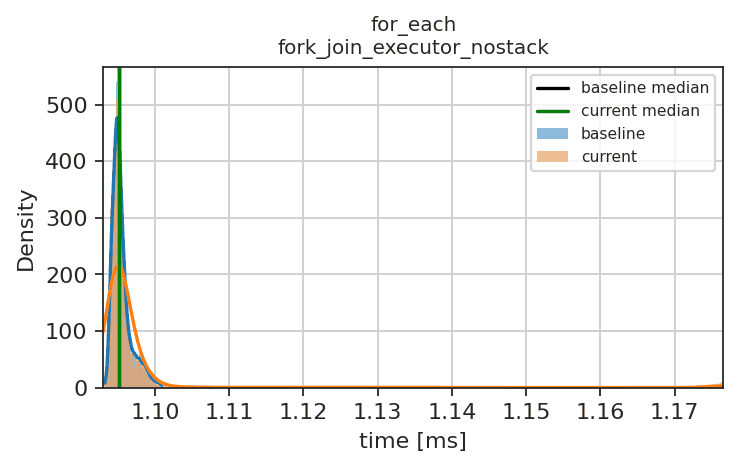
  1. for_each, fork_join_executor: Performance is better by 6.67 % (KS-stat: 0.9166666666666666)

transform_reduce_scaling

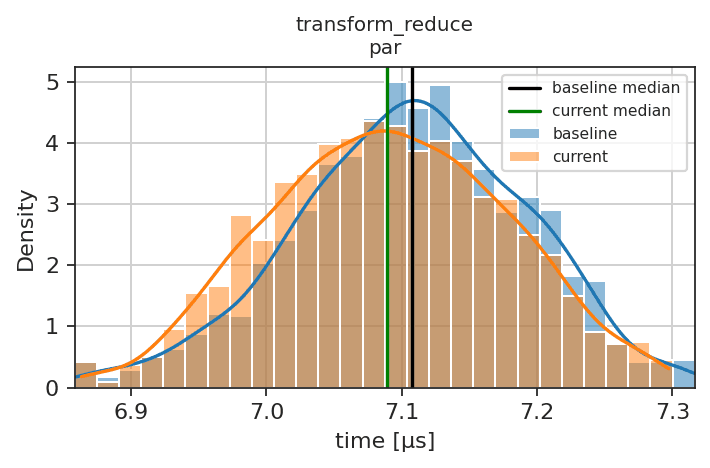
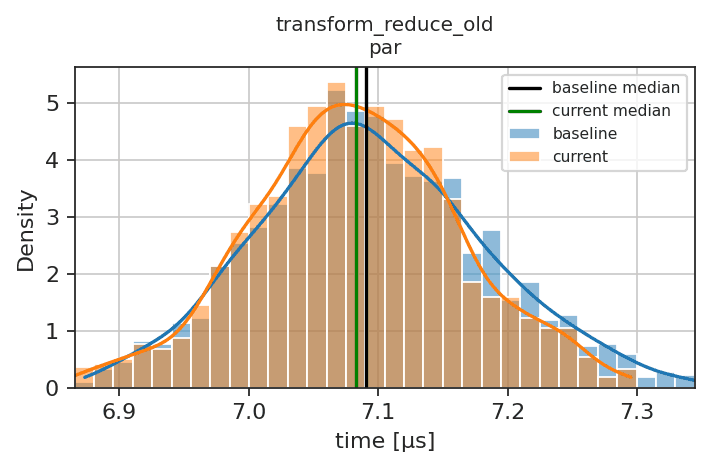
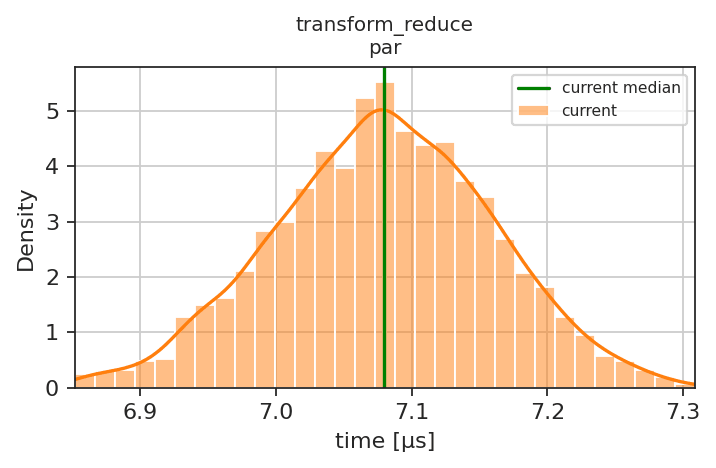
  1. transform_reduce, par: Performance is better by 57.55 % (KS-stat: 1.0)
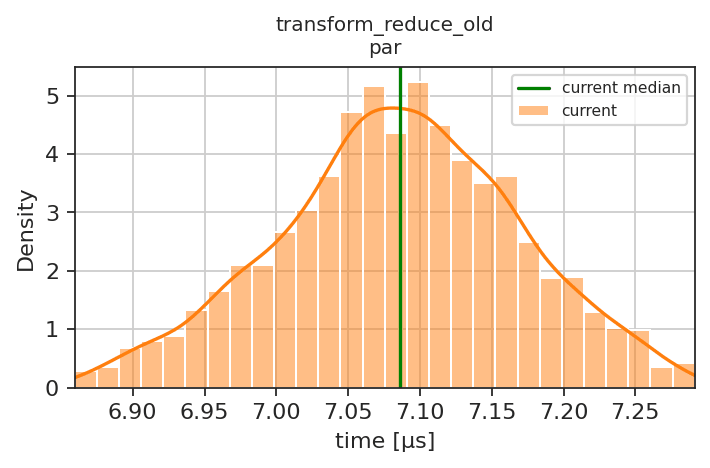
  2. transform_reduce_old, par: Performance is better by 69.66 % (KS-stat: 1.0)

benchmark_is_heap_until

  1. hpx::heap_until, seq: Performance is better by 35.65 % (KS-stat: 1.0)
  2. hpx::heap_until, par: Performance is better by 32.25 % (KS-stat: 0.9583333333333334)

benchmark_inplace_merge

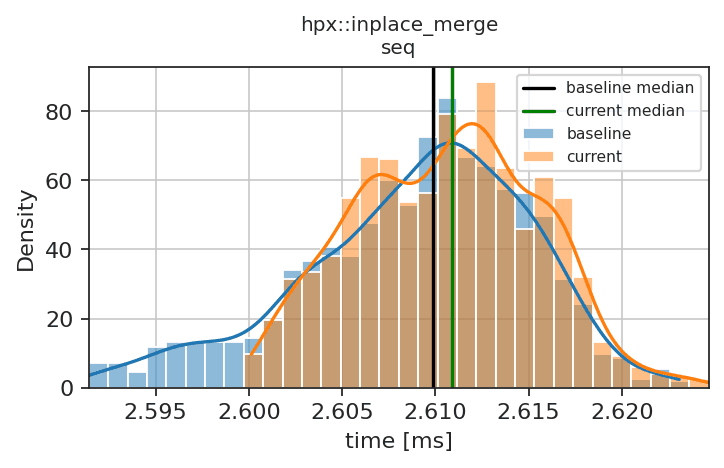
  1. hpx::inplace_merge, seq: Performance is better by 41.21 % (KS-stat: 0.9166666666666666)
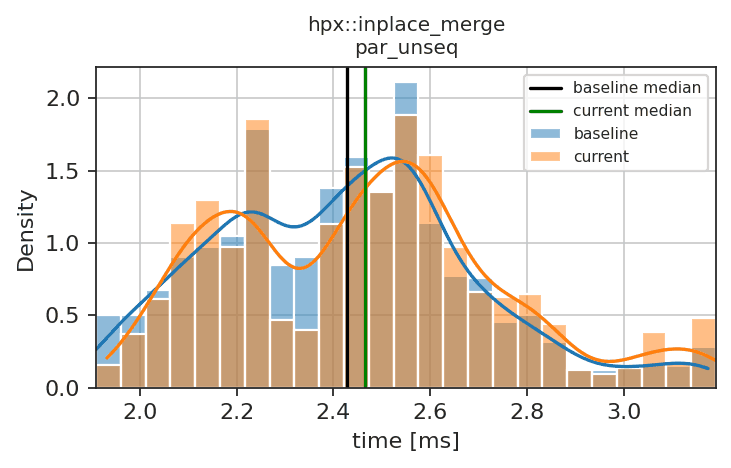
  2. hpx::inplace_merge, par_unseq: Performance is better by 49.60 % (KS-stat: 1.0)

benchmark_is_heap

  1. hpx::is_heap, seq: Performance is better by 100.00 % (KS-stat: 1.0)

benchmark_remove

  1. hpx::remove, seq: Performance is better by 21.37 % (KS-stat: 1.0)
  2. hpx::remove, par: Performance is better by 30.38 % (KS-stat: 0.9583333333333334)
  3. hpx::remove, par_unseq: Performance is better by 31.96 % (KS-stat: 0.9166666666666666)

benchmark_remove_if

  1. hpx::remove_if, seq: Performance is better by 32.02 % (KS-stat: 1.0)
  2. hpx::remove_if, par: Performance is better by 38.20 % (KS-stat: 1.0)
  3. hpx::remove_if, par_unseq: Performance is better by 37.82 % (KS-stat: 1.0)

minmax_element_performance

  1. hpx::min, par: Performance is better by 19.53 % (KS-stat: 0.9166666666666666)

small_vector_benchmark

  1. hpx::small_vector, <fxn<void()>, 1>: Performance is worse by 9.37 % (KS-stat: 0.7916666666666666)
  2. hpx::small_vector, <fxn<void()>, 8>: Performance is better by 1.68 % (KS-stat: 0.9166666666666666)

stream_report

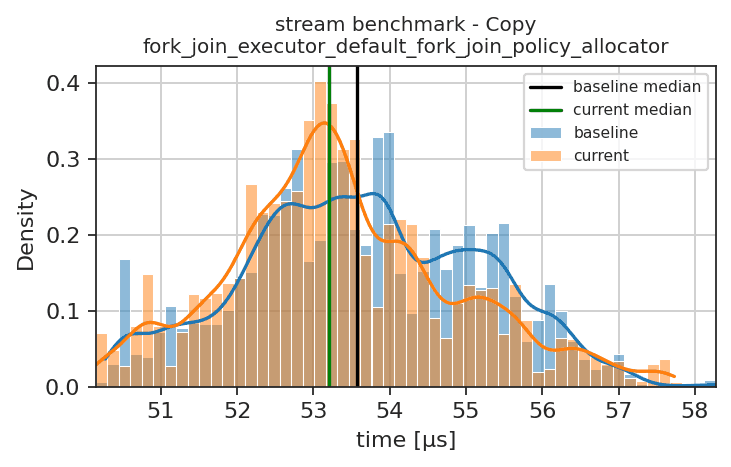
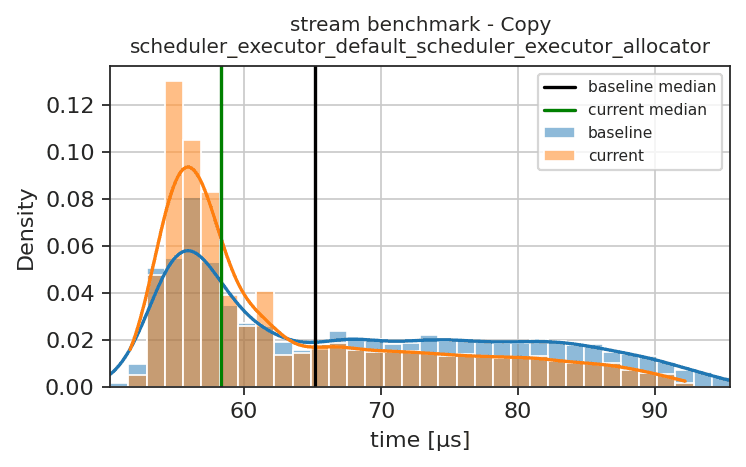
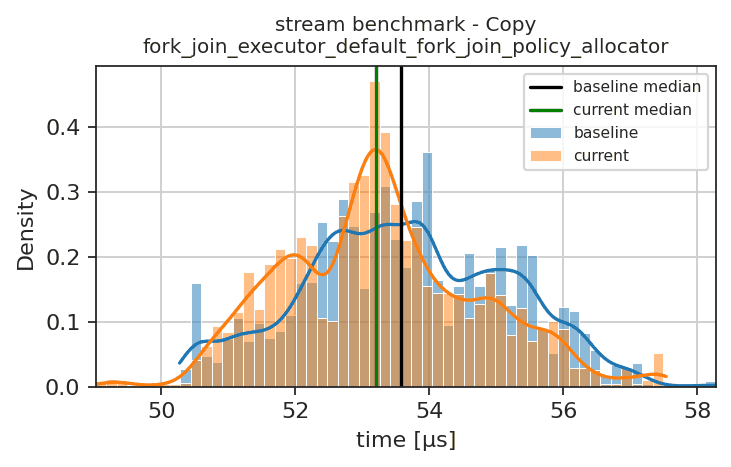
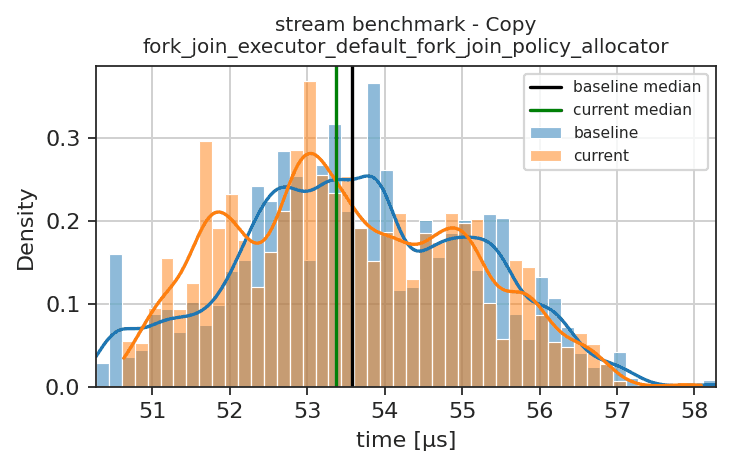
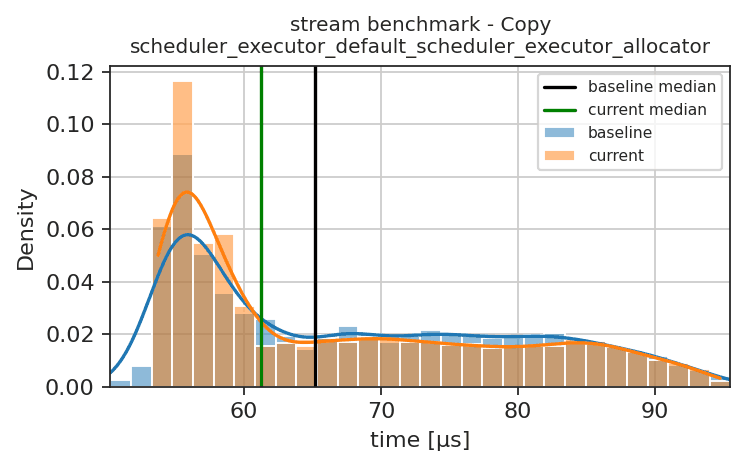
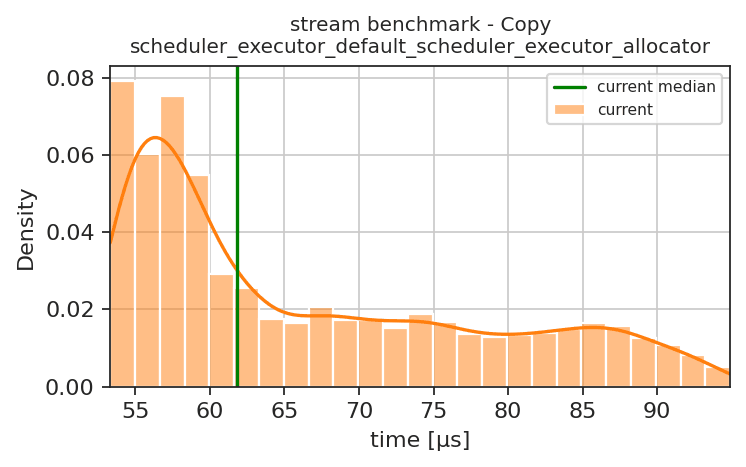
  1. stream benchmark - Copy, fork_join_executor_default_fork_join_policy_allocator: Performance is better by 6.28 % (KS-stat: 1.0)
  2. Stream benchmark - Scale, fork_join_executor_default_fork_join_policy_allocator: Performance is better by 13.83 % (KS-stat: 1.0)
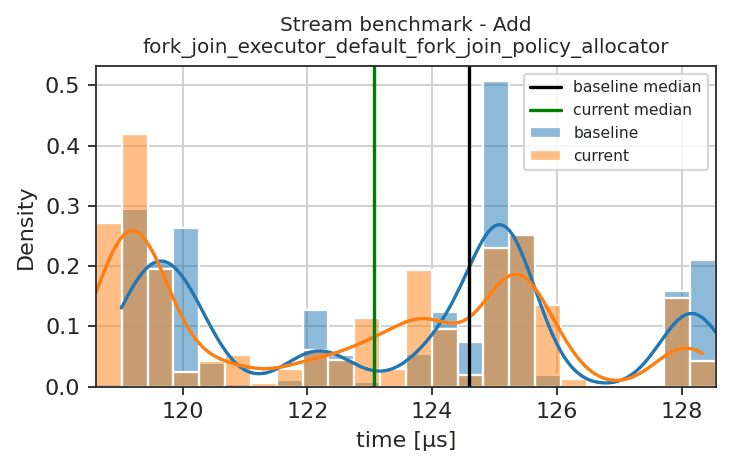
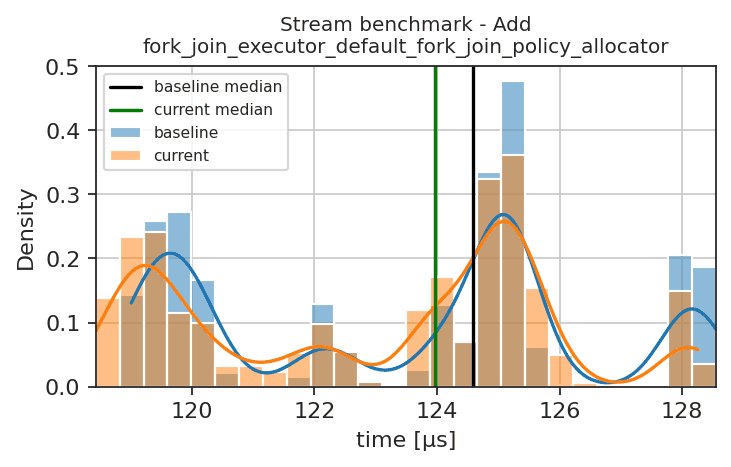
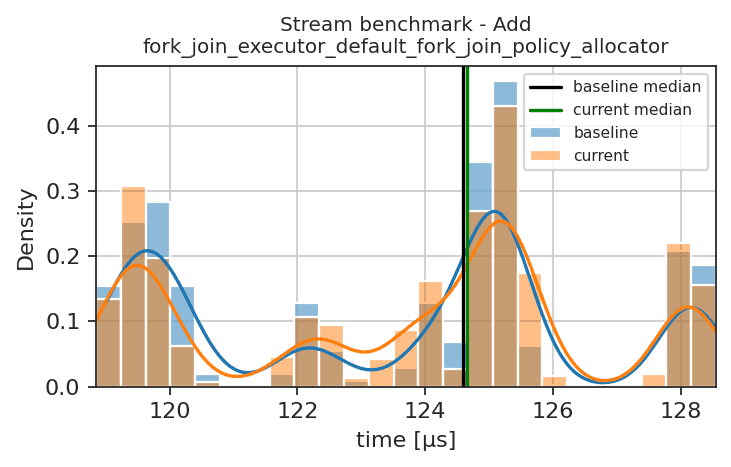
  3. Stream benchmark - Add, fork_join_executor_default_fork_join_policy_allocator: Performance is better by 4.41 % (KS-stat: 0.7916666666666666)
  4. Stream benchmark - Triad, fork_join_executor_default_fork_join_policy_allocator: Performance is better by 2.72 % (KS-stat: 0.75)
  5. Stream benchmark - Scale, scheduler_executor_default_scheduler_executor_allocator: Performance is better by 18.22 % (KS-stat: 0.9583333333333334)

foreach_report

  1. for_each, fork_join_executor: Performance is better by 6.40 % (KS-stat: 0.9166666666666666)

transform_reduce_scaling

  1. transform_reduce, par: Performance is better by 57.40 % (KS-stat: 1.0)
  2. transform_reduce_old, par: Performance is better by 69.81 % (KS-stat: 1.0)

benchmark_is_heap_until

  1. hpx::heap_until, seq: Performance is better by 36.00 % (KS-stat: 1.0)
  2. hpx::heap_until, par: Performance is better by 32.02 % (KS-stat: 0.9583333333333334)

benchmark_inplace_merge

  1. hpx::inplace_merge, seq: Performance is better by 41.25 % (KS-stat: 0.9583333333333334)
  2. hpx::inplace_merge, par_unseq: Performance is better by 49.76 % (KS-stat: 1.0)

benchmark_is_heap

  1. hpx::is_heap, seq: Performance is better by 100.00 % (KS-stat: 1.0)

benchmark_remove

  1. hpx::remove, seq: Performance is better by 21.60 % (KS-stat: 0.9583333333333334)
  2. hpx::remove, par: Performance is better by 31.05 % (KS-stat: 1.0)
  3. hpx::remove, par_unseq: Performance is better by 33.81 % (KS-stat: 1.0)

benchmark_remove_if

  1. hpx::remove_if, seq: Performance is better by 29.03 % (KS-stat: 1.0)
  2. hpx::remove_if, par: Performance is better by 37.92 % (KS-stat: 1.0)
  3. hpx::remove_if, par_unseq: Performance is better by 37.52 % (KS-stat: 1.0)

small_vector_benchmark

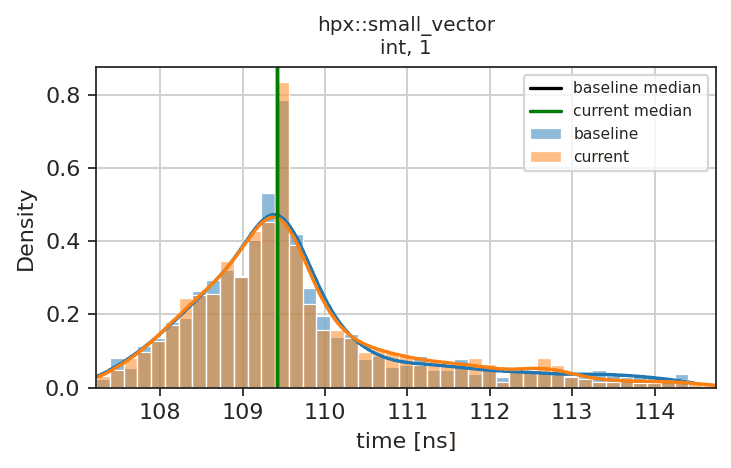
  1. hpx::small_vector, <int, 1>: Performance is worse by 2.90 % (KS-stat: 0.7916666666666666)
  2. hpx::small_vector, <fxn<void()>, 1>: Performance is better by 8.86 % (KS-stat: 0.7916666666666666)

stream_report

  1. stream benchmark - Copy, fork_join_executor_default_fork_join_policy_allocator: Performance is better by 1.72 % (KS-stat: 0.7916666666666666)

minmax_element_performance

  1. hpx::min, par: Performance is worse by 89.74 % (KS-stat: 0.75)

stream_report

  1. stream benchmark - Copy, fork_join_executor_default_fork_join_policy_allocator: Performance is worse by 3.32 % (KS-stat: 1.0)
  2. Stream benchmark - Scale, fork_join_executor_default_fork_join_policy_allocator: Performance is worse by 21.33 % (KS-stat: 0.8333333333333334)
  3. Stream benchmark - Add, fork_join_executor_default_fork_join_policy_allocator: Performance is worse by 16.76 % (KS-stat: 0.7916666666666666)
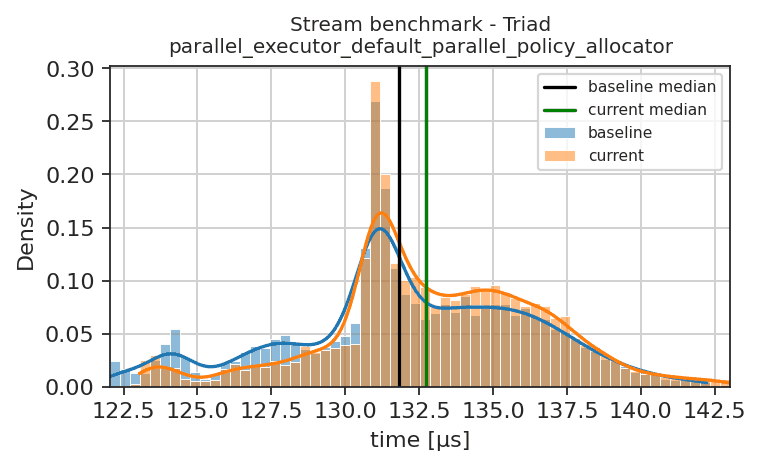
  4. Stream benchmark - Triad, fork_join_executor_default_fork_join_policy_allocator: Performance is worse by 3.95 % (KS-stat: 0.75)
  5. Stream benchmark - Add, scheduler_executor_default_scheduler_executor_allocator: Performance is better by 15.89 % (KS-stat: 0.9166666666666666)

benchmark_remove_if

  1. hpx::remove_if, seq: Performance is better by 4.40 % (KS-stat: 0.75)

@Pansysk75

Copy link
Copy Markdown
Contributor

@vrnimje Good job! ;)

@vrnimje
vrnimje force-pushed the cdash_perftest_bench branch from 839caf7 to 7dd0bf7 Compare July 15, 2024 07:24
@Pansysk75

Copy link
Copy Markdown
Contributor

retest lsu perf

@StellarBot

Copy link
Copy Markdown
Collaborator
Performance test report

minmax_element_performance

  1. hpx::minmax, par: Performance is worse by 684.99 % (KS-stat: 1.0)
  2. hpx::min, par: Performance is worse by 673.06 % (KS-stat: 1.0)
  3. hpx::max, par: Performance is worse by 592.64 % (KS-stat: 1.0)

small_vector_benchmark

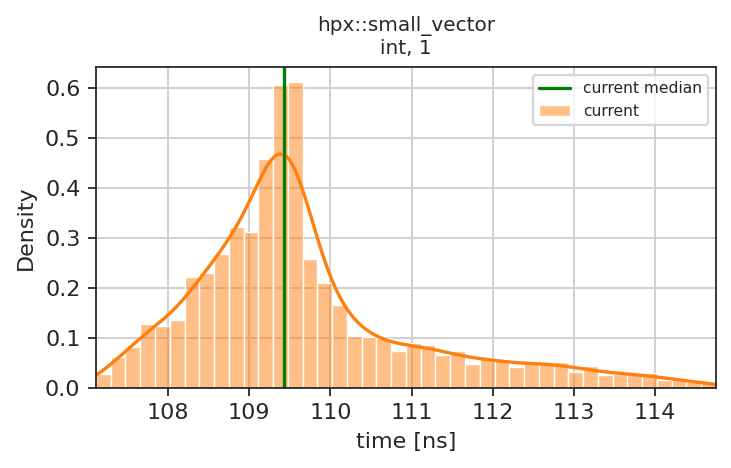
  1. hpx::small_vector, <int, 1>: Performance is worse by 263.85 % (KS-stat: 1.0)
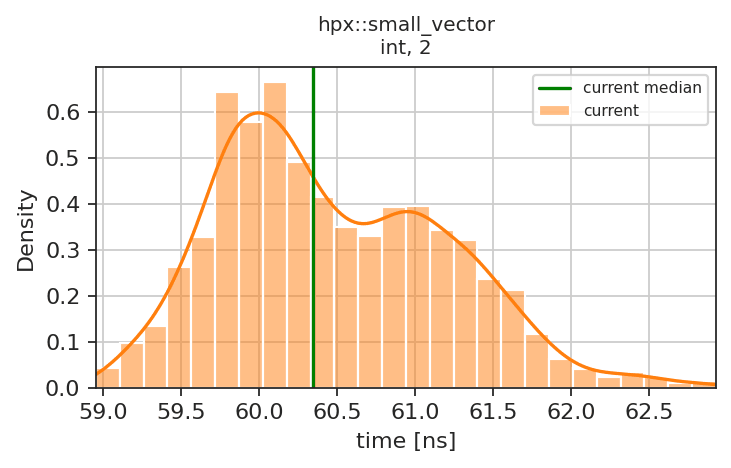
  2. hpx::small_vector, <int, 2>: Performance is worse by 40.18 % (KS-stat: 1.0)
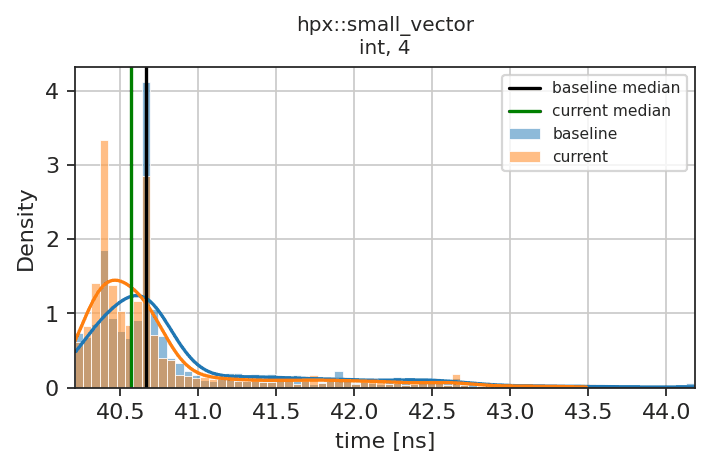
  3. hpx::small_vector, <int, 4>: Performance is worse by 12.99 % (KS-stat: 1.0)
  4. hpx::small_vector, <int, 8>: Performance is worse by 11.92 % (KS-stat: 1.0)
  5. hpx::small_vector, <int, 16>: Performance is worse by 152.67 % (KS-stat: 1.0)
  6. hpx::small_vector, <fxn<void()>, 1>: Performance is worse by 55.53 % (KS-stat: 1.0)
  7. hpx::small_vector, <fxn<void()>, 2>: Performance is worse by 61.71 % (KS-stat: 1.0)
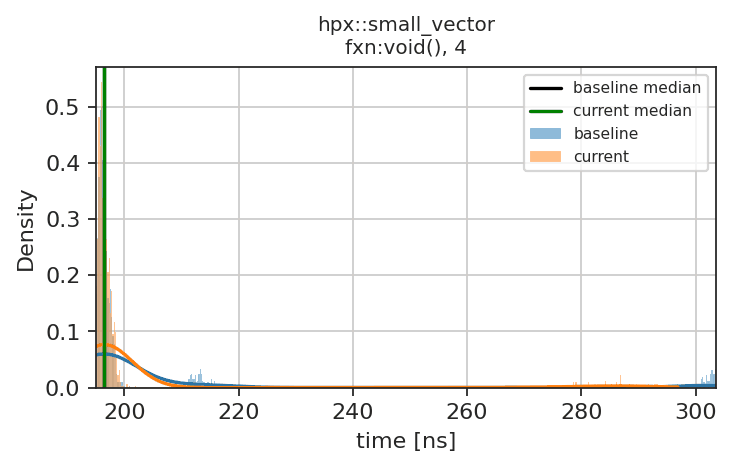
  8. hpx::small_vector, <fxn<void()>, 4>: Performance is worse by 61.73 % (KS-stat: 1.0)
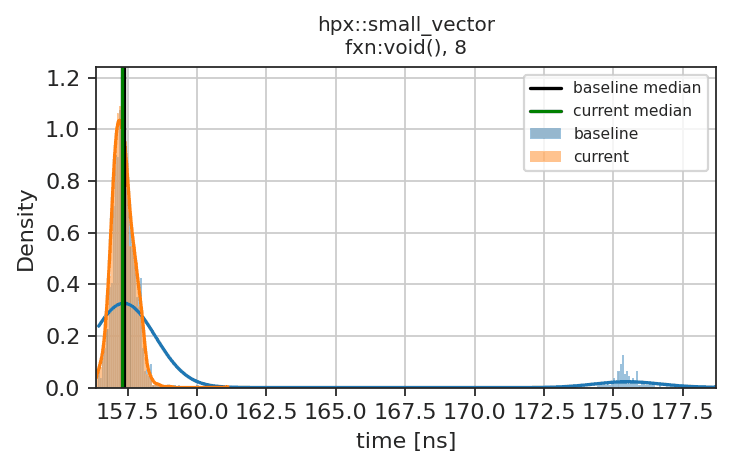
  9. hpx::small_vector, <fxn<void()>, 8>: Performance is worse by 56.28 % (KS-stat: 1.0)
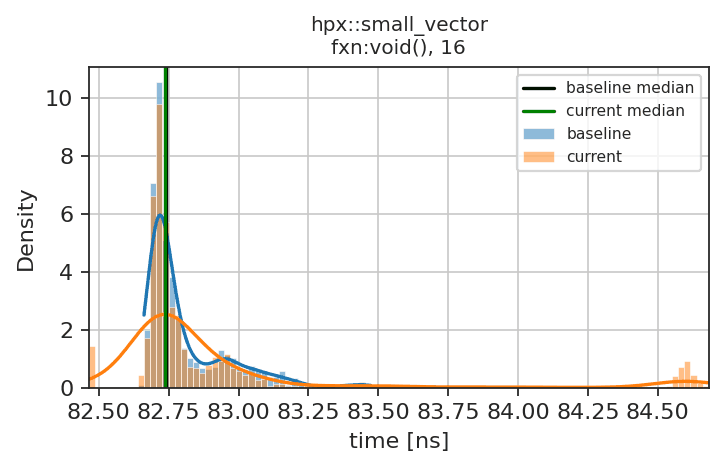
  10. hpx::small_vector, <fxn<void()>, 16>: Performance is worse by 33.41 % (KS-stat: 1.0)

future_overhead_report

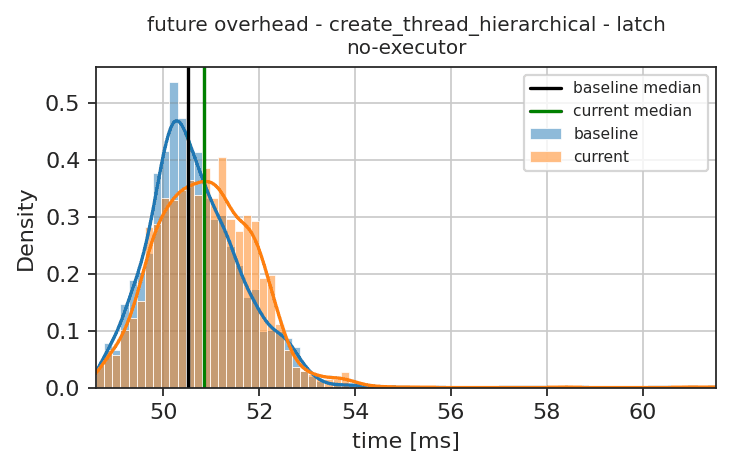
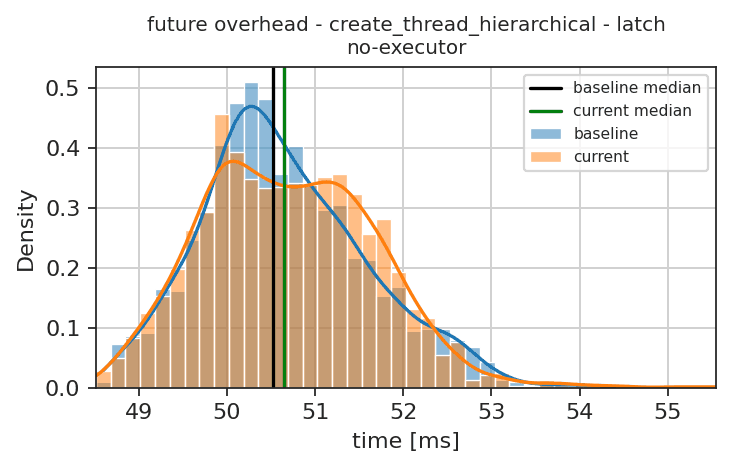
  1. future overhead - create_thread_hierarchical - latch, no-executor: Performance is worse by 25.22 % (KS-stat: 1.0)

stream_report

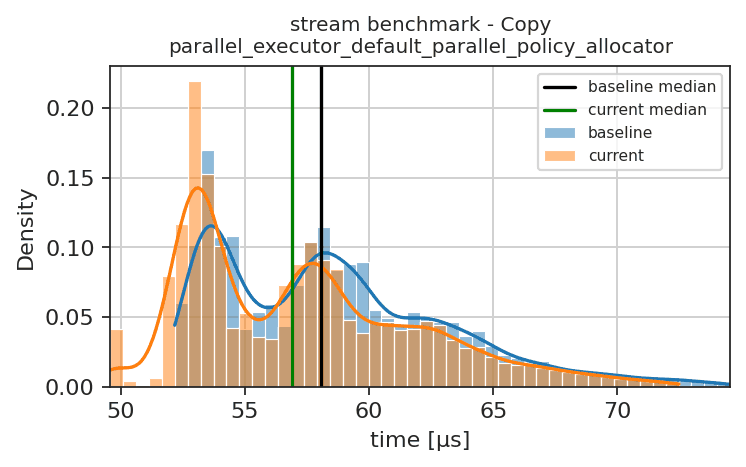
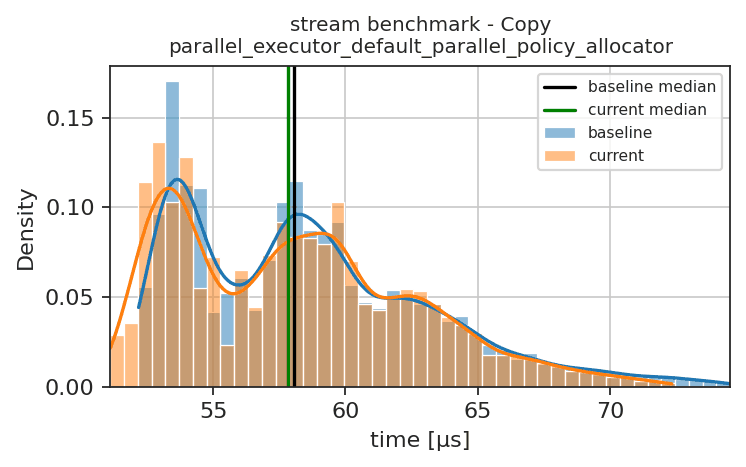
  1. stream benchmark - Copy, parallel_executor_default_parallel_policy_allocator: Performance is worse by 63.23 % (KS-stat: 1.0)
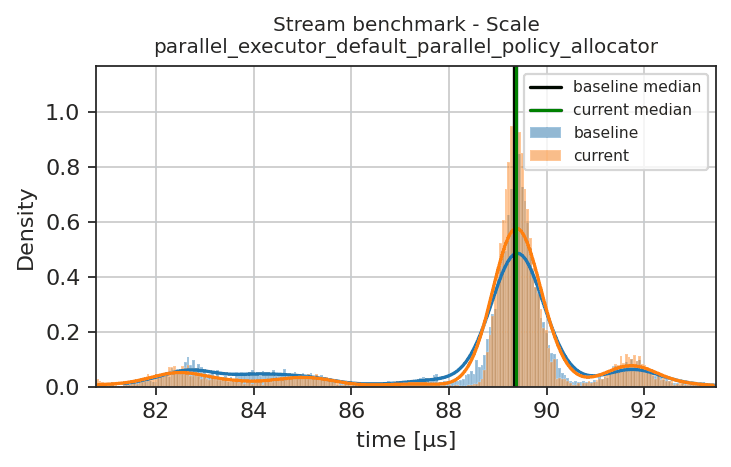
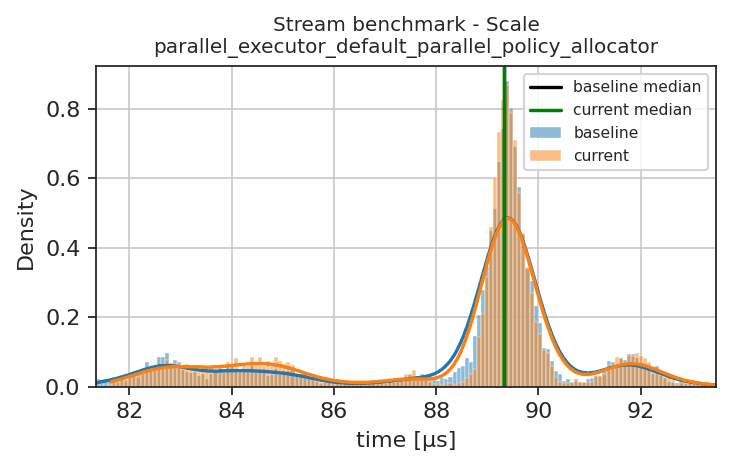
  2. Stream benchmark - Scale, parallel_executor_default_parallel_policy_allocator: Performance is worse by 56.55 % (KS-stat: 1.0)
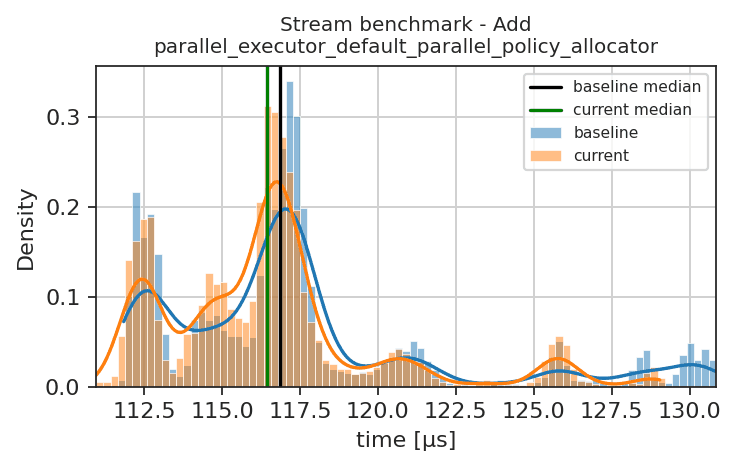
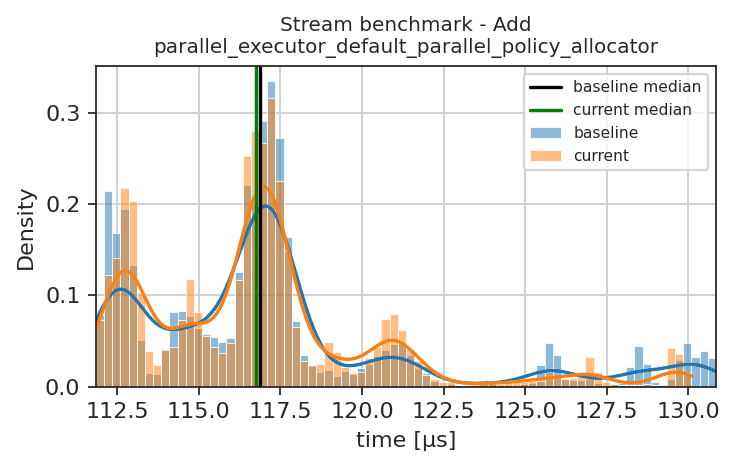
  3. Stream benchmark - Add, parallel_executor_default_parallel_policy_allocator: Performance is better by 62.21 % (KS-stat: 1.0)
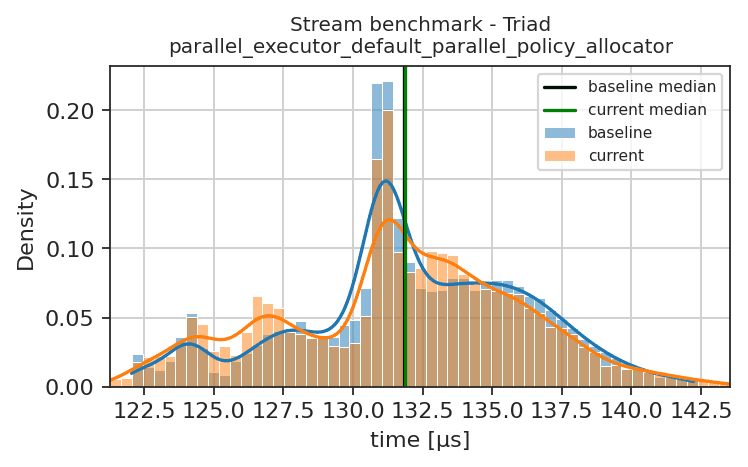
  4. Stream benchmark - Triad, parallel_executor_default_parallel_policy_allocator: Performance is better by 65.10 % (KS-stat: 1.0)
  5. stream benchmark - Copy, fork_join_executor_default_fork_join_policy_allocator: Performance is worse by 86.27 % (KS-stat: 1.0)
  6. Stream benchmark - Scale, fork_join_executor_default_fork_join_policy_allocator: Performance is worse by 99.81 % (KS-stat: 1.0)
  7. Stream benchmark - Add, fork_join_executor_default_fork_join_policy_allocator: Performance is better by 55.27 % (KS-stat: 1.0)
  8. Stream benchmark - Triad, fork_join_executor_default_fork_join_policy_allocator: Performance is better by 55.84 % (KS-stat: 1.0)
  9. stream benchmark - Copy, scheduler_executor_default_scheduler_executor_allocator: Performance is worse by 50.42 % (KS-stat: 1.0)
  10. Stream benchmark - Scale, scheduler_executor_default_scheduler_executor_allocator: Performance is worse by 69.31 % (KS-stat: 1.0)
  11. Stream benchmark - Add, scheduler_executor_default_scheduler_executor_allocator: Performance is better by 63.30 % (KS-stat: 1.0)
  12. Stream benchmark - Triad, scheduler_executor_default_scheduler_executor_allocator: Performance is better by 62.60 % (KS-stat: 1.0)

foreach_report

  1. for_each, scheduler_executor: Performance is worse by 28.49 % (KS-stat: 1.0)
  2. for_each, parallel_executor: Performance is worse by 25.10 % (KS-stat: 1.0)
  3. for_each, fork_join_executor: Performance is worse by 37.94 % (KS-stat: 1.0)

transform_reduce_scaling

  1. transform_reduce, par: Performance is worse by 110.51 % (KS-stat: 1.0)
  2. transform_reduce_old, par: Performance is worse by 106.89 % (KS-stat: 1.0)

benchmark_is_heap_until

  1. hpx::heap_until, seq: Performance is worse by 99.46 % (KS-stat: 1.0)
  2. hpx::heap_until, par: Performance is worse by 74.45 % (KS-stat: 1.0)
  3. hpx::heap_until, par_unseq: Performance is worse by 49.09 % (KS-stat: 1.0)

benchmark_merge

  1. hpx::merge, seq: Performance is worse by 54.67 % (KS-stat: 1.0)

benchmark_inplace_merge

  1. hpx::inplace_merge, seq: Performance is worse by 382.71 % (KS-stat: 1.0)
  2. hpx::inplace_merge, par: Performance is worse by 60.73 % (KS-stat: 1.0)
  3. hpx::inplace_merge, par_unseq: Performance is worse by 93.27 % (KS-stat: 1.0)

benchmark_is_heap

  1. hpx::is_heap, seq: Performance is worse by 96.82 % (KS-stat: 1.0)
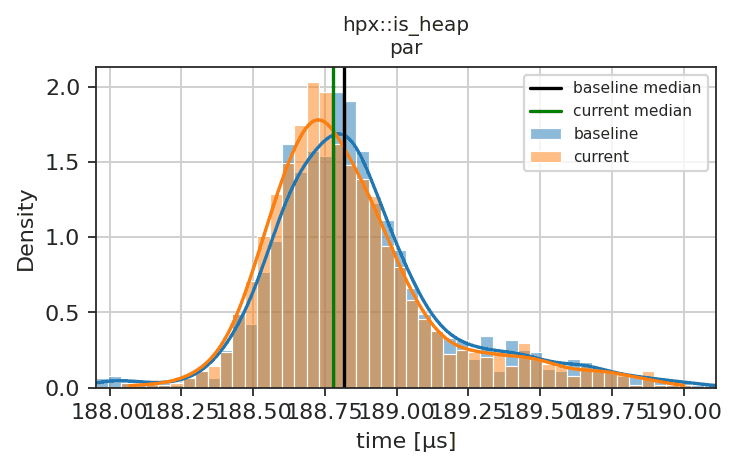
  2. hpx::is_heap, par: Performance is worse by 65.44 % (KS-stat: 1.0)
  3. hpx::is_heap, par_unseq: Performance is worse by 43.38 % (KS-stat: 1.0)

benchmark_remove

  1. hpx::remove, seq: Performance is worse by 38.81 % (KS-stat: 1.0)
  2. hpx::remove, par: Performance is worse by 16.27 % (KS-stat: 1.0)
  3. hpx::remove, par_unseq: Performance is worse by 120.62 % (KS-stat: 1.0)

benchmark_remove_if

  1. hpx::remove_if, seq: Performance is worse by 51.09 % (KS-stat: 1.0)
  2. hpx::remove_if, par: Performance is worse by 2.03 % (KS-stat: 0.875)
  3. hpx::remove_if, par_unseq: Performance is worse by 113.51 % (KS-stat: 1.0)

@StellarBot

Copy link
Copy Markdown
Collaborator
Performance test report
Test nameExecutorBetter/Worse, Mean Percentage diff.P-value
minmax_element_performance
hpx::minmaxparWorse, 685.77 %1.00
hpx::minparWorse, 674.79 %1.00
hpx::maxparWorse, 584.09 %1.00
small_vector_benchmark
hpx::small_vector<int, 1>Worse, 263.72 %1.00
hpx::small_vector<int, 2>Worse, 40.21 %1.00
hpx::small_vector<int, 4>Worse, 12.20 %1.00
hpx::small_vector<int, 8>Worse, 11.88 %1.00
hpx::small_vector<int, 16>Worse, 152.55 %1.00
hpx::small_vector<fxn<void()>, 1>Worse, 55.27 %1.00
hpx::small_vector<fxn<void()>, 2>Worse, 63.02 %1.00
hpx::small_vector<fxn<void()>, 4>Worse, 48.58 %1.00
hpx::small_vector<fxn<void()>, 8>Worse, 55.99 %1.00
hpx::small_vector<fxn<void()>, 16>Worse, 33.80 %1.00
future_overhead_report
future overhead - create_thread_hierarchical - latchno-executorWorse, 22.88 %1.00
stream_report
stream benchmark - Copyparallel_executor_default_parallel_policy_allocatorWorse, 58.95 %1.00
Stream benchmark - Scaleparallel_executor_default_parallel_policy_allocatorWorse, 56.65 %1.00
Stream benchmark - Addparallel_executor_default_parallel_policy_allocatorBetter, 64.50 %1.00
Stream benchmark - Triadparallel_executor_default_parallel_policy_allocatorBetter, 64.92 %1.00
stream benchmark - Copyfork_join_executor_default_fork_join_policy_allocatorWorse, 85.93 %1.00
Stream benchmark - Scalefork_join_executor_default_fork_join_policy_allocatorWorse, 99.20 %1.00
Stream benchmark - Addfork_join_executor_default_fork_join_policy_allocatorBetter, 55.34 %1.00
Stream benchmark - Triadfork_join_executor_default_fork_join_policy_allocatorBetter, 55.93 %1.00
stream benchmark - Copyscheduler_executor_default_scheduler_executor_allocatorWorse, 49.91 %1.00
Stream benchmark - Scalescheduler_executor_default_scheduler_executor_allocatorWorse, 69.49 %1.00
Stream benchmark - Addscheduler_executor_default_scheduler_executor_allocatorBetter, 62.62 %1.00
Stream benchmark - Triadscheduler_executor_default_scheduler_executor_allocatorBetter, 62.41 %1.00
foreach_report
for_eachscheduler_executorWorse, 26.06 %1.00
for_eachparallel_executorWorse, 23.66 %1.00
for_eachfork_join_executorWorse, 37.93 %1.00
transform_reduce_scaling
transform_reduceparWorse, 112.45 %1.00
transform_reduce_oldparWorse, 109.52 %1.00
benchmark_is_heap_until
hpx::heap_untilseqWorse, 99.39 %1.00
hpx::heap_untilparWorse, 72.63 %1.00
hpx::heap_untilpar_unseqWorse, 49.93 %1.00
benchmark_merge
hpx::mergeseqWorse, 52.33 %1.00
hpx::mergeparWorse, 1.17 %0.97
hpx::mergepar_unseqWorse, 2.64 %1.00
benchmark_inplace_merge
hpx::inplace_mergeseqWorse, 380.73 %1.00
hpx::inplace_mergeparWorse, 62.94 %1.00
hpx::inplace_mergepar_unseqWorse, 98.69 %1.00
benchmark_is_heap
hpx::is_heapseqWorse, 96.73 %1.00
hpx::is_heapparWorse, 64.44 %1.00
hpx::is_heappar_unseqWorse, 45.19 %1.00
benchmark_remove
hpx::removeseqWorse, 39.55 %1.00
hpx::removeparWorse, 17.24 %1.00
hpx::removepar_unseqWorse, 122.52 %1.00
benchmark_remove_if
hpx::remove_ifseqWorse, 48.53 %1.00
hpx::remove_ifparWorse, 0.69 %1.00
hpx::remove_ifpar_unseqWorse, 111.36 %1.00

@StellarBot

Copy link
Copy Markdown
Collaborator
Performance test report
Test nameExecutorBetter/Worse, Mean Percentage diff.P-value
minmax_element_performance
hpx::minmaxparWorse, 690.41 %1.00
hpx::minparWorse, 668.38 %1.00
hpx::maxparWorse, 582.41 %1.00
small_vector_benchmark
hpx::small_vector<int, 1>Worse, 265.20 %1.00
hpx::small_vector<int, 2>Worse, 41.16 %1.00
hpx::small_vector<int, 4>Worse, 12.78 %1.00
hpx::small_vector<int, 8>Worse, 11.70 %1.00
hpx::small_vector<int, 16>Worse, 153.43 %1.00
hpx::small_vector<fxn<void()>, 1>Worse, 55.44 %1.00
hpx::small_vector<fxn<void()>, 2>Worse, 61.89 %1.00
hpx::small_vector<fxn<void()>, 4>Worse, 48.80 %1.00
hpx::small_vector<fxn<void()>, 8>Worse, 56.90 %1.00
hpx::small_vector<fxn<void()>, 16>Worse, 33.76 %1.00
future_overhead_report
future overhead - create_thread_hierarchical - latchno-executorWorse, 31.72 %1.00
stream_report
stream benchmark - Copyparallel_executor_default_parallel_policy_allocatorWorse, 58.10 %1.00
Stream benchmark - Scaleparallel_executor_default_parallel_policy_allocatorWorse, 67.57 %1.00
Stream benchmark - Addparallel_executor_default_parallel_policy_allocatorBetter, 63.82 %1.00
Stream benchmark - Triadparallel_executor_default_parallel_policy_allocatorBetter, 64.79 %1.00
stream benchmark - Copyfork_join_executor_default_fork_join_policy_allocatorWorse, 86.92 %1.00
Stream benchmark - Scalefork_join_executor_default_fork_join_policy_allocatorWorse, 100.00 %1.00
Stream benchmark - Addfork_join_executor_default_fork_join_policy_allocatorBetter, 55.24 %1.00
Stream benchmark - Triadfork_join_executor_default_fork_join_policy_allocatorBetter, 55.87 %1.00
stream benchmark - Copyscheduler_executor_default_scheduler_executor_allocatorWorse, 57.98 %1.00
Stream benchmark - Scalescheduler_executor_default_scheduler_executor_allocatorWorse, 72.86 %1.00
Stream benchmark - Addscheduler_executor_default_scheduler_executor_allocatorBetter, 62.96 %1.00
Stream benchmark - Triadscheduler_executor_default_scheduler_executor_allocatorBetter, 62.07 %1.00
foreach_report
for_eachscheduler_executorWorse, 26.04 %1.00
for_eachparallel_executorWorse, 26.10 %1.00
for_eachfork_join_executorWorse, 38.06 %1.00
transform_reduce_scaling
transform_reduceparWorse, 109.74 %1.00
transform_reduce_oldparWorse, 108.16 %1.00
benchmark_is_heap_until
hpx::heap_untilseqWorse, 99.40 %1.00
hpx::heap_untilparWorse, 74.08 %1.00
hpx::heap_untilpar_unseqWorse, 49.48 %1.00
benchmark_merge
hpx::mergeseqWorse, 52.03 %1.00
hpx::mergeparWorse, 7.31 %1.00
hpx::mergepar_unseqWorse, 4.81 %1.00
benchmark_inplace_merge
hpx::inplace_mergeseqWorse, 380.75 %1.00
hpx::inplace_mergeparWorse, 73.96 %1.00
hpx::inplace_mergepar_unseqWorse, 104.96 %1.00
benchmark_is_heap
hpx::is_heapseqWorse, 96.82 %1.00
hpx::is_heapparWorse, 65.13 %1.00
hpx::is_heappar_unseqWorse, 48.66 %1.00
benchmark_remove
hpx::removeseqWorse, 37.51 %1.00
hpx::removeparWorse, 15.15 %1.00
hpx::removepar_unseqWorse, 118.78 %1.00
benchmark_remove_if
hpx::remove_ifseqWorse, 50.06 %1.00
hpx::remove_ifparWorse, 1.27 %1.00
hpx::remove_ifpar_unseqWorse, 112.58 %1.00

@codacy-production

codacy-production Bot commented Jul 22, 2024 •

Copy link
Copy Markdown

Coverage summary from Codacy

See diff coverage on Codacy

Coverage variation Diff coverage
✅ +0.09% ✅ 83.05%
Coverage variation details
Coverable lines Covered lines Coverage
Common ancestor commit (17bbc63) 222489 189245 85.06%
Head commit (1589588) 190872 (-31617) 162525 (-26720) 85.15% (+0.09%)

Coverage variation is the difference between the coverage for the head and common ancestor commits of the pull request branch: <coverage of head commit> - <coverage of common ancestor commit>

Diff coverage details
Coverable lines Covered lines Diff coverage
Pull request (#6514) 177 147 83.05%

Diff coverage is the percentage of lines that are covered by tests out of the coverable lines that the pull request added or modified: <covered lines added or modified>/<coverable lines added or modified> * 100%

See your quality gate settings    Change summary preferences


🚀 Don’t miss a bit, follow what’s new on Codacy.

Codacy stopped sending the deprecated coverage status on June 5th, 2024. Learn more

@StellarBot

Copy link
Copy Markdown
Collaborator
Performance test report
Test nameExecutorBetter/Worse, Mean Percentage diff.P-value
minmax_element_performance
hpx::minmaxparWorse, 683.24 %1.00
hpx::minparWorse, 675.42 %1.00
hpx::maxparWorse, 588.80 %1.00
small_vector_benchmark
hpx::small_vector<int, 1>Worse, 264.86 %1.00
hpx::small_vector<int, 2>Worse, 40.27 %1.00
hpx::small_vector<int, 4>Worse, 12.64 %1.00
hpx::small_vector<int, 8>Worse, 11.58 %1.00
hpx::small_vector<int, 16>Worse, 153.88 %1.00
hpx::small_vector<fxn<void()>, 1>Worse, 55.26 %1.00
hpx::small_vector<fxn<void()>, 2>Worse, 62.73 %1.00
hpx::small_vector<fxn<void()>, 4>Worse, 48.74 %1.00
hpx::small_vector<fxn<void()>, 8>Worse, 56.35 %1.00
hpx::small_vector<fxn<void()>, 16>Worse, 33.49 %1.00
future_overhead_report
future overhead - create_thread_hierarchical - latchno-executorWorse, 25.47 %1.00
stream_report
stream benchmark - Copyparallel_executor_default_parallel_policy_allocatorWorse, 53.15 %1.00
Stream benchmark - Scaleparallel_executor_default_parallel_policy_allocatorWorse, 54.65 %1.00
Stream benchmark - Addparallel_executor_default_parallel_policy_allocatorBetter, 64.41 %1.00
Stream benchmark - Triadparallel_executor_default_parallel_policy_allocatorBetter, 64.95 %1.00
stream benchmark - Copyfork_join_executor_default_fork_join_policy_allocatorWorse, 86.49 %1.00
Stream benchmark - Scalefork_join_executor_default_fork_join_policy_allocatorWorse, 99.62 %1.00
Stream benchmark - Addfork_join_executor_default_fork_join_policy_allocatorBetter, 55.23 %1.00
Stream benchmark - Triadfork_join_executor_default_fork_join_policy_allocatorBetter, 55.80 %1.00
stream benchmark - Copyscheduler_executor_default_scheduler_executor_allocatorWorse, 48.24 %1.00
Stream benchmark - Scalescheduler_executor_default_scheduler_executor_allocatorWorse, 72.86 %1.00
Stream benchmark - Addscheduler_executor_default_scheduler_executor_allocatorBetter, 62.80 %1.00
Stream benchmark - Triadscheduler_executor_default_scheduler_executor_allocatorBetter, 62.34 %1.00
foreach_report
for_eachscheduler_executorWorse, 25.94 %1.00
for_eachparallel_executorWorse, 23.41 %1.00
for_eachfork_join_executorWorse, 38.02 %1.00
transform_reduce_scaling
transform_reduceparWorse, 114.66 %1.00
transform_reduce_oldparWorse, 108.22 %1.00
benchmark_is_heap_until
hpx::heap_untilseqWorse, 99.46 %1.00
hpx::heap_untilparWorse, 94.96 %1.00
hpx::heap_untilpar_unseqWorse, 47.92 %1.00
benchmark_merge
hpx::mergeseqWorse, 52.57 %1.00
hpx::mergeparWorse, 2.49 %1.00
hpx::mergepar_unseqWorse, 2.47 %1.00
benchmark_inplace_merge
hpx::inplace_mergeseqWorse, 381.81 %1.00
hpx::inplace_mergeparWorse, 78.62 %1.00
hpx::inplace_mergepar_unseqWorse, 107.19 %1.00
benchmark_is_heap
hpx::is_heapseqWorse, 96.80 %1.00
hpx::is_heapparWorse, 64.86 %1.00
hpx::is_heappar_unseqWorse, 43.24 %1.00
benchmark_remove
hpx::removeseqWorse, 39.62 %1.00
hpx::removeparWorse, 17.16 %1.00
hpx::removepar_unseqWorse, 122.23 %1.00
benchmark_remove_if
hpx::remove_ifseqWorse, 50.38 %1.00
hpx::remove_ifparWorse, 1.86 %1.00
hpx::remove_ifpar_unseqWorse, 114.44 %1.00

@StellarBot

Copy link
Copy Markdown
Collaborator
Performance test report
Test nameExecutorBetter/Worse, Mean Percentage diff.P-value
small_vector_benchmark
hpx::small_vector<fxn<void()>, 16>Better, 0.15 %0.99
stream_report
stream benchmark - Copyparallel_executor_default_parallel_policy_allocatorWorse, 3.95 %1.00
Stream benchmark - Addparallel_executor_default_parallel_policy_allocatorWorse, 2.32 %1.00
stream benchmark - Copyfork_join_executor_default_fork_join_policy_allocatorBetter, 0.42 %1.00
Stream benchmark - Scalefork_join_executor_default_fork_join_policy_allocatorBetter, 0.08 %1.00
Stream benchmark - Addfork_join_executor_default_fork_join_policy_allocatorWorse, 0.18 %1.00
Stream benchmark - Triadfork_join_executor_default_fork_join_policy_allocatorWorse, 0.51 %1.00
stream benchmark - Copyscheduler_executor_default_scheduler_executor_allocatorWorse, 3.36 %1.00
Stream benchmark - Scalescheduler_executor_default_scheduler_executor_allocatorBetter, 0.88 %0.97
benchmark_merge
hpx::mergeseqBetter, 0.21 %1.00
hpx::mergeparBetter, 3.99 %1.00
hpx::mergepar_unseqBetter, 1.94 %0.99
benchmark_inplace_merge
hpx::inplace_mergeseqWorse, 0.31 %1.00
benchmark_remove
hpx::removeseqBetter, 0.73 %1.00
hpx::removeparBetter, 0.65 %1.00
hpx::removepar_unseqBetter, 0.65 %1.00
benchmark_remove_if
hpx::remove_ifparBetter, 0.54 %1.00

1 similar comment
@StellarBot

Copy link
Copy Markdown
Collaborator
Performance test report
Test nameExecutorBetter/Worse, Mean Percentage diff.P-value
small_vector_benchmark
hpx::small_vector<fxn<void()>, 16>Better, 0.15 %0.99
stream_report
stream benchmark - Copyparallel_executor_default_parallel_policy_allocatorWorse, 3.95 %1.00
Stream benchmark - Addparallel_executor_default_parallel_policy_allocatorWorse, 2.32 %1.00
stream benchmark - Copyfork_join_executor_default_fork_join_policy_allocatorBetter, 0.42 %1.00
Stream benchmark - Scalefork_join_executor_default_fork_join_policy_allocatorBetter, 0.08 %1.00
Stream benchmark - Addfork_join_executor_default_fork_join_policy_allocatorWorse, 0.18 %1.00
Stream benchmark - Triadfork_join_executor_default_fork_join_policy_allocatorWorse, 0.51 %1.00
stream benchmark - Copyscheduler_executor_default_scheduler_executor_allocatorWorse, 3.36 %1.00
Stream benchmark - Scalescheduler_executor_default_scheduler_executor_allocatorBetter, 0.88 %0.97
benchmark_merge
hpx::mergeseqBetter, 0.21 %1.00
hpx::mergeparBetter, 3.99 %1.00
hpx::mergepar_unseqBetter, 1.94 %0.99
benchmark_inplace_merge
hpx::inplace_mergeseqWorse, 0.31 %1.00
benchmark_remove
hpx::removeseqBetter, 0.73 %1.00
hpx::removeparBetter, 0.65 %1.00
hpx::removepar_unseqBetter, 0.65 %1.00
benchmark_remove_if
hpx::remove_ifparBetter, 0.54 %1.00

@StellarBot

Copy link
Copy Markdown
Collaborator
Performance test report
Test nameExecutorMean Percentage Diff.P value
small_vector_benchmark
hpx::small_vector<fxn<void()>, 2>0.32 %0.98803
hpx::small_vector<fxn<void()>, 8>-0.17 %0.98803
hpx::small_vector<fxn<void()>, 16>0.20 %0.99568
future_overhead_report
future overhead - create_thread_hierarchical - latchno-executor-7.46 %1.00000
stream_report
stream benchmark - Copyparallel_executor_default_parallel_policy_allocator-3.85 %1.00000
Stream benchmark - Scaleparallel_executor_default_parallel_policy_allocator4.31 %0.99990
Stream benchmark - Addparallel_executor_default_parallel_policy_allocator-4.34 %1.00000
stream benchmark - Copyfork_join_executor_default_fork_join_policy_allocator0.46 %1.00000
Stream benchmark - Scalefork_join_executor_default_fork_join_policy_allocator0.12 %1.00000
Stream benchmark - Addfork_join_executor_default_fork_join_policy_allocator-0.35 %0.99860
Stream benchmark - Triadfork_join_executor_default_fork_join_policy_allocator-0.12 %0.99860
Stream benchmark - Scalescheduler_executor_default_scheduler_executor_allocator5.37 %0.99990
Stream benchmark - Addscheduler_executor_default_scheduler_executor_allocator-4.72 %1.00000
transform_reduce_scaling
transform_reduce_oldpar-1.39 %0.97009
benchmark_merge
hpx::mergeseq0.17 %1.00000
benchmark_inplace_merge
hpx::inplace_mergeseq-0.14 %0.97009
hpx::inplace_mergepar-2.71 %0.97009
benchmark_remove
hpx::removeseq-1.54 %1.00000
hpx::removepar-1.04 %1.00000
hpx::removepar_unseq-1.01 %1.00000
benchmark_remove_if
hpx::remove_ifseq0.86 %1.00000
hpx::remove_ifpar0.41 %0.99860
hpx::remove_ifpar_unseq1.11 %1.00000

@StellarBot

Copy link
Copy Markdown
Collaborator
Performance test report
Test nameExecutorMean Percentage Diff.P value
future_overhead_report
future overhead - create_thread_hierarchical - latchno-executor-8.80 %-1.24e-01, -4.39e-02
transform_reduce_scaling
transform_reducepar0.34 %-1.30e-02, 2.30e-02
transform_reduce_oldpar-1.41 %-2.43e-02, -3.62e-03
benchmark_nth_element
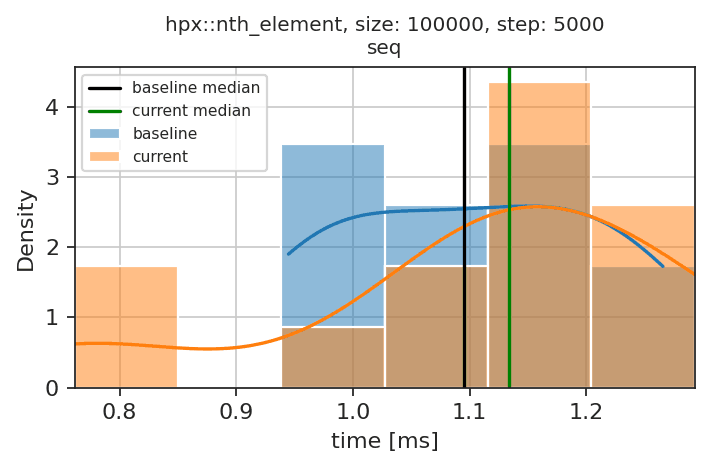
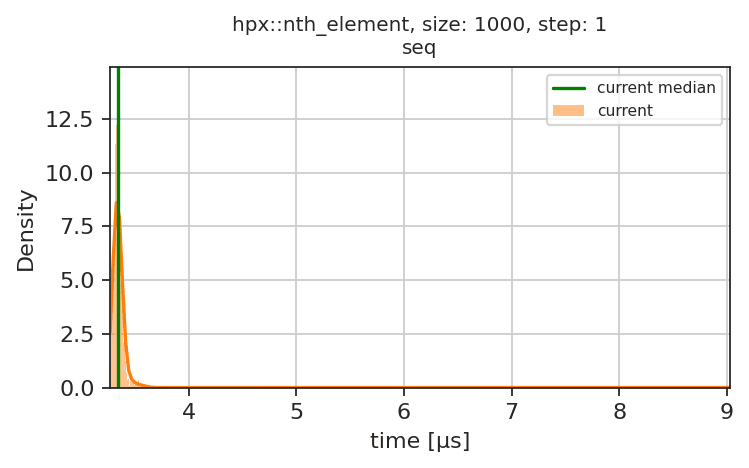
hpx::nth_element, size: 1000, step: 1seq4.50 %-2.00e-02, 1.15e-01
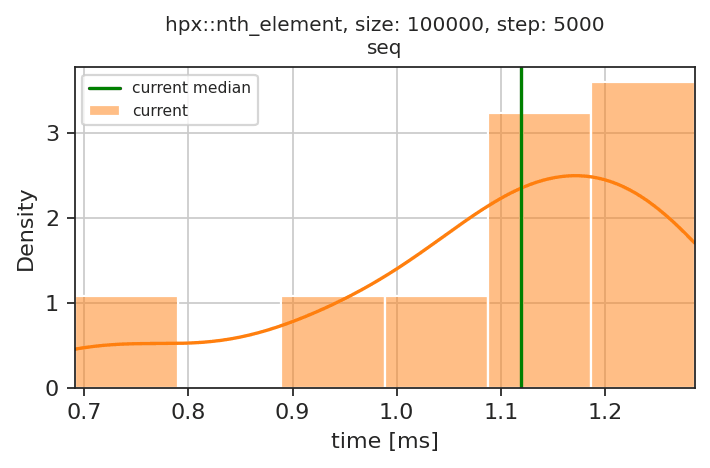
hpx::nth_element, size: 100000, step: 5000seq-30.75 %-3.21e-01, -2.97e-01
benchmark_nth_element_parallel
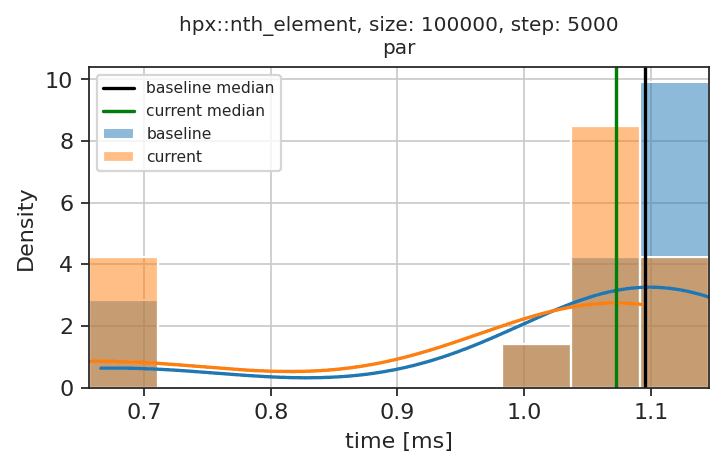
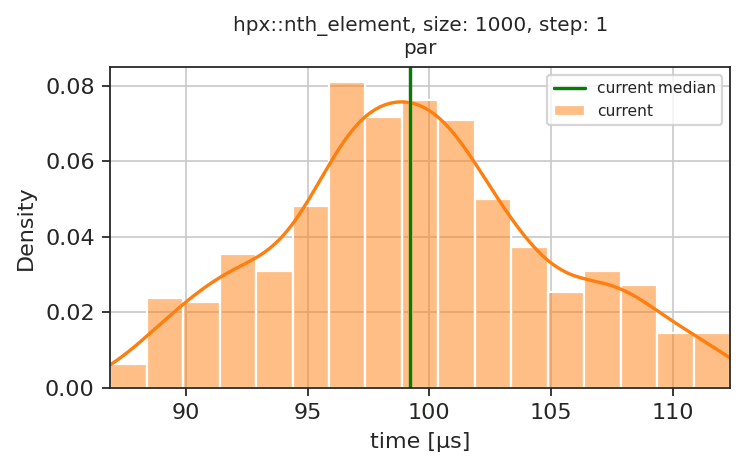
hpx::nth_element, size: 1000, step: 1par-397.66 %-4.07e+00, -3.88e+00
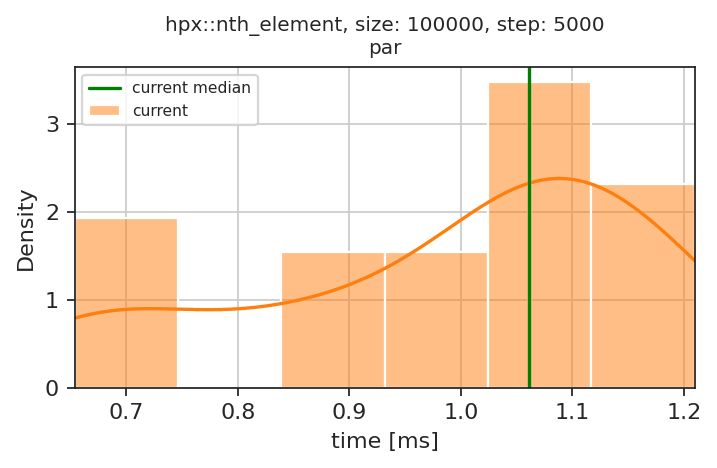
hpx::nth_element, size: 100000, step: 5000par-35.29 %-4.39e-01, -2.93e-01

@codacy-production

Copy link
Copy Markdown

Coverage summary from Codacy

See diff coverage on Codacy

Coverage variation Diff coverage
✅ -0.06% ✅ 86.05%
Coverage variation details
Coverable lines Covered lines Coverage
Common ancestor commit (17bbc63) 222489 189245 85.06%
Head commit (91a6d3f) 196688 (-25801) 167183 (-22062) 85.00% (-0.06%)

Coverage variation is the difference between the coverage for the head and common ancestor commits of the pull request branch: <coverage of head commit> - <coverage of common ancestor commit>

Diff coverage details
Coverable lines Covered lines Diff coverage
Pull request (#6514) 387 333 86.05%

Diff coverage is the percentage of lines that are covered by tests out of the coverable lines that the pull request added or modified: <covered lines added or modified>/<coverable lines added or modified> * 100%

See your quality gate settings    Change summary preferences

Codacy stopped sending the deprecated coverage status on June 5th, 2024. Learn more

@StellarBot

Copy link
Copy Markdown
Collaborator
Performance test report
Test nameExecutorMean Percentage Diff.Coefficient of variation
minmax_element_performance
hpx::minmaxpar1.96 %1.18651
hpx::minpar-0.11 %15.25031
hpx::maxpar0.05 %42.50429
small_vector_benchmark
hpx::small_vector<int, 8>0.52 %0.47845
future_overhead_report
future overhead - create_thread_hierarchical - latchno-executor0.20 %14.95532
stream_report
Stream benchmark - Addscheduler_executor_default_scheduler_executor_allocator1.57 %0.38104
transform_reduce_scaling
transform_reducepar-0.05 %15.06714
benchmark_is_heap_until
hpx::heap_untilpar-0.28 %6.53407
benchmark_merge
hpx::mergeseq1.25 %0.04249
hpx::mergepar-5.67 %0.12528
hpx::mergepar_unseq-1.26 %0.45807
benchmark_inplace_merge
hpx::inplace_mergepar10.49 %0.15894
hpx::inplace_mergepar_unseq11.33 %0.12265
benchmark_is_heap
hpx::is_heappar0.41 %7.33730
benchmark_remove_if
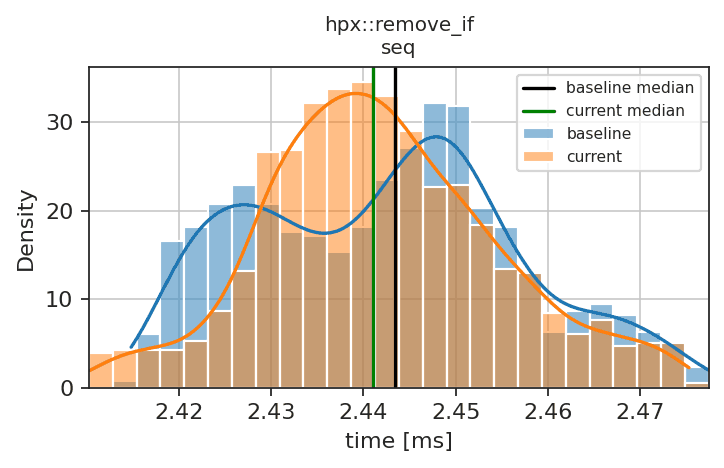
hpx::remove_ifseq-0.90 %0.11926
benchmark_partial_sort
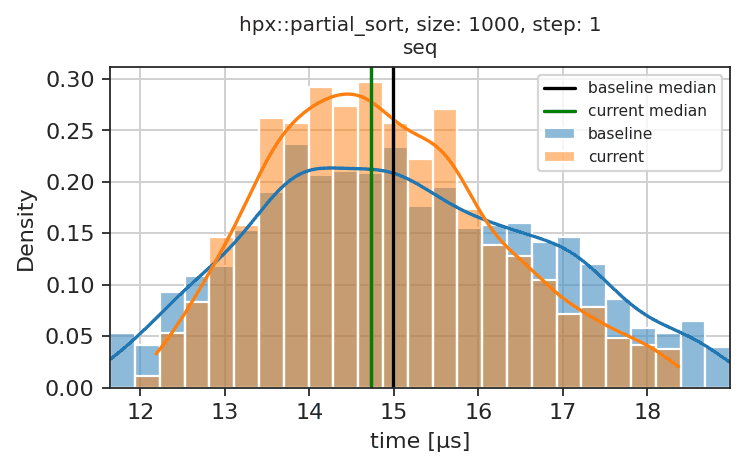
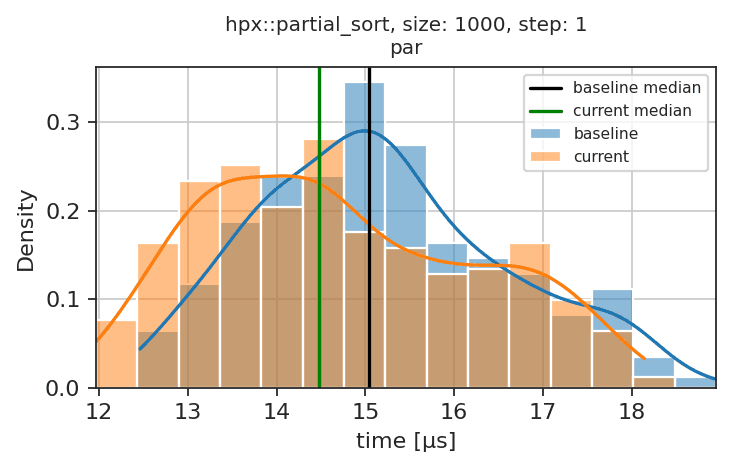
hpx::partial_sort, size: 1000, step: 1seq5.45 %0.02869
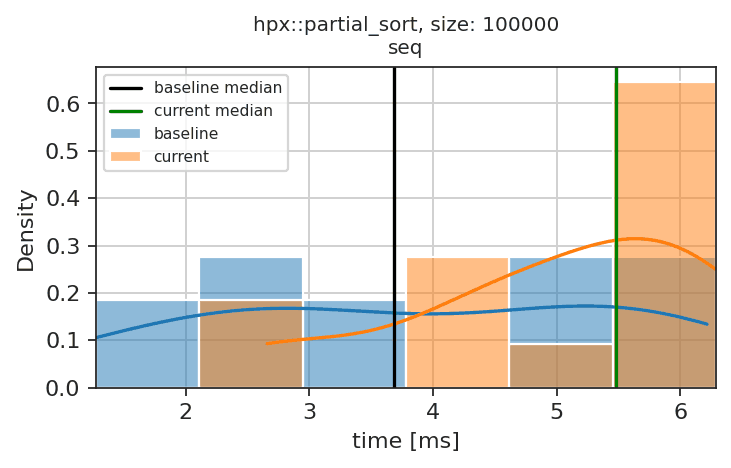
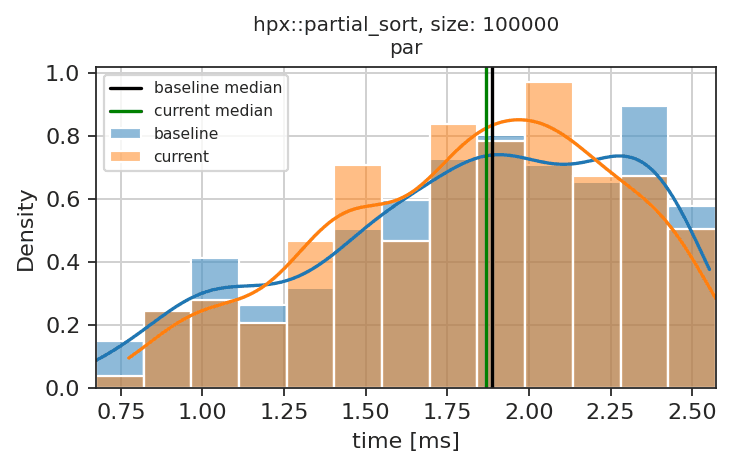
hpx::partial_sort, size: 100000seq-1.46 %0.09224
benchmark_partial_sort_parallel
hpx::partial_sort, size: 100000par9.37 %0.02204
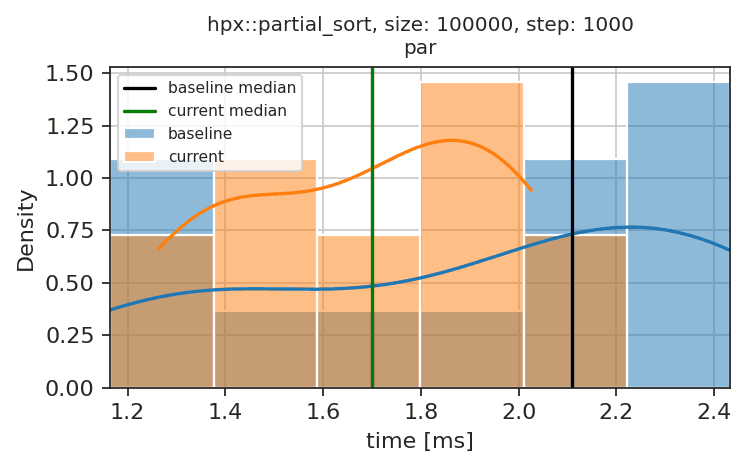
hpx::partial_sort, size: 100000, step: 1000par9.83 %0.05209
benchmark_nth_element_parallel
hpx::nth_element, size: 1000, step: 1par-9.17 %0.98629

@StellarBot

Copy link
Copy Markdown
Collaborator
Performance test report
Test nameExecutorMean Percentage Diff.Coefficient of variation
minmax_element_performance
hpx::minmaxpar-1.19 %1.76652
hpx::minpar-0.42 %4.10981
hpx::maxpar-0.03 %21.59520
small_vector_benchmark
hpx::small_vector<fxn<void()>, 1>-0.70 %0.25417
future_overhead_report
future overhead - create_thread_hierarchical - latchno-executor-12.63 %0.30442
stream_report
stream benchmark - Copyparallel_executor_default_parallel_policy_allocator-4.30 %0.19204
Stream benchmark - Scaleparallel_executor_default_parallel_policy_allocator-2.52 %0.44144
Stream benchmark - Scalefork_join_executor_default_fork_join_policy_allocator1.32 %0.03324
stream benchmark - Copyscheduler_executor_default_scheduler_executor_allocator-2.47 %0.45755
benchmark_is_heap_until
hpx::heap_untilpar0.00 %545.61520
benchmark_merge
hpx::mergeseq1.42 %0.04377
hpx::mergepar-3.80 %0.16191
hpx::mergepar_unseq-1.84 %0.34002
benchmark_inplace_merge
hpx::inplace_mergeseq-1.15 %0.06430
hpx::inplace_mergepar9.01 %0.23894
hpx::inplace_mergepar_unseq10.28 %0.12878
benchmark_is_heap
hpx::is_heappar-1.09 %2.25798
benchmark_remove_if
hpx::remove_ifseq0.90 %0.12822
hpx::remove_ifpar1.14 %0.07750
hpx::remove_ifpar_unseq1.05 %0.26647
benchmark_partial_sort
hpx::partial_sort, size: 1000, step: 1seq11.04 %0.01236
hpx::partial_sort, size: 100000seq-1.33 %0.11409
benchmark_partial_sort_parallel
hpx::partial_sort, size: 1000, step: 1par1.46 %0.10163
hpx::partial_sort, size: 100000, step: 1000par11.22 %0.04772
benchmark_nth_element_parallel
hpx::nth_element, size: 100000, step: 5000par-0.83 %1.46625

@StellarBot

Copy link
Copy Markdown
Collaborator
Performance test report
Test nameExecutorMean Percentage Diff.Coefficient of variation
minmax_element_performance
hpx::minmaxpar1.44 %1.37947
hpx::minpar0.61 %2.33319
hpx::maxpar-1.19 %1.02057
small_vector_benchmark
hpx::small_vector<int, 8>0.53 %0.48545
future_overhead_report
future overhead - create_thread_hierarchical - latchno-executor-0.57 %6.01747
stream_report
Stream benchmark - Scaleparallel_executor_default_parallel_policy_allocator0.10 %15.05362
Stream benchmark - Addparallel_executor_default_parallel_policy_allocator0.99 %0.49465
Stream benchmark - Scalescheduler_executor_default_scheduler_executor_allocator-3.21 %0.41208
foreach_report
for_eachscheduler_executor1.68 %0.45645
transform_reduce_scaling
transform_reducepar-0.35 %3.86105
benchmark_is_heap_until
hpx::heap_untilpar0.24 %8.86754
benchmark_merge
hpx::mergeseq1.31 %0.04086
hpx::mergepar-4.19 %0.16176
benchmark_inplace_merge
hpx::inplace_mergepar3.85 %0.38700
hpx::inplace_mergepar_unseq2.51 %0.30816
benchmark_is_heap
hpx::is_heappar0.46 %6.13407
benchmark_partial_sort
hpx::partial_sort, size: 1000, step: 1seq2.12 %0.08383
hpx::partial_sort, size: 100000seq-1.61 %0.08373
benchmark_partial_sort_parallel
hpx::partial_sort, size: 1000, step: 1par4.87 %0.03424
hpx::partial_sort, size: 100000par6.46 %0.04234
hpx::partial_sort, size: 100000, step: 1000par8.15 %0.06312
benchmark_nth_element_parallel
hpx::nth_element, size: 1000, step: 1par-11.40 %0.95884
hpx::nth_element, size: 100000, step: 5000par-0.85 %1.66926

@StellarBot

Copy link
Copy Markdown
Collaborator
Performance test report
Test nameExecutorMean Percentage Diff.Coefficient of variation
minmax_element_performance
hpx::minmaxpar-0.02 %38.85135
hpx::minpar-0.45 %3.00622
hpx::maxpar-0.79 %1.32714
future_overhead_report
future overhead - create_thread_hierarchical - latchno-executor2.13 %1.30068
stream_report
stream benchmark - Copyparallel_executor_default_parallel_policy_allocator-0.50 %1.70264
Stream benchmark - Addparallel_executor_default_parallel_policy_allocator-1.72 %0.36338
Stream benchmark - Triadparallel_executor_default_parallel_policy_allocator1.15 %0.43536
stream benchmark - Copyscheduler_executor_default_scheduler_executor_allocator-3.75 %0.23468
benchmark_is_heap_until
hpx::heap_untilpar-0.32 %6.67886
hpx::heap_untilpar_unseq0.55 %1.61591
benchmark_merge
hpx::mergeseq1.39 %0.03691
hpx::mergepar-4.63 %0.15019
hpx::mergepar_unseq-2.20 %0.29576
benchmark_inplace_merge
hpx::inplace_mergepar0.78 %2.12736
hpx::inplace_mergepar_unseq-0.17 %7.34590
benchmark_is_heap
hpx::is_heappar1.70 %1.47054
benchmark_remove_if
hpx::remove_ifseq0.89 %0.11261
hpx::remove_ifpar0.98 %0.08889
hpx::remove_ifpar_unseq1.04 %0.26621
benchmark_partial_sort
hpx::partial_sort, size: 1000, step: 1seq7.16 %0.02518
hpx::partial_sort, size: 100000seq-0.89 %0.14436
benchmark_partial_sort_parallel
hpx::partial_sort, size: 100000par2.15 %0.12404
hpx::partial_sort, size: 100000, step: 1000par4.85 %0.09645
benchmark_nth_element_parallel
hpx::nth_element, size: 100000, step: 5000par-0.98 %1.18164

@StellarBot

Copy link
Copy Markdown
Collaborator
Performance test report
Test nameExecutorMean Percentage Diff.Coefficient of variation
minmax_element_performance
hpx::minmaxpar0.76 %2.77272
hpx::minpar0.79 %1.61304
hpx::maxpar-0.17 %5.72621
future_overhead_report
future overhead - create_thread_hierarchical - latchno-executor-0.03 %22.37570
stream_report
stream benchmark - Copyparallel_executor_default_parallel_policy_allocator-0.49 %1.92481
Stream benchmark - Scaleparallel_executor_default_parallel_policy_allocator4.08 %0.24543
Stream benchmark - Scalescheduler_executor_default_scheduler_executor_allocator-0.25 %4.56995
Stream benchmark - Addscheduler_executor_default_scheduler_executor_allocator1.58 %0.32848
foreach_report
for_eachscheduler_executor0.34 %2.50820
transform_reduce_scaling
transform_reduce_oldpar1.95 %0.24662
benchmark_is_heap_until
hpx::heap_untilpar-0.40 %4.96255
hpx::heap_untilpar_unseq1.71 %0.42793
benchmark_merge
hpx::mergeseq1.00 %0.05525
hpx::mergepar-6.01 %0.11866
hpx::mergepar_unseq-2.66 %0.22683
benchmark_inplace_merge
hpx::inplace_mergepar-0.25 %5.96318
hpx::inplace_mergepar_unseq3.69 %0.24123
benchmark_is_heap
hpx::is_heappar0.24 %12.59392
hpx::is_heappar_unseq-1.71 %0.44053
benchmark_remove
hpx::removeseq2.08 %0.08116
hpx::removepar1.18 %0.11226
hpx::removepar_unseq0.90 %0.09645
benchmark_remove_if
hpx::remove_ifseq1.00 %0.10714
hpx::remove_ifpar1.29 %0.07869
hpx::remove_ifpar_unseq1.32 %0.18357
benchmark_partial_sort
hpx::partial_sort, size: 1000, step: 1seq9.64 %0.01445
hpx::partial_sort, size: 100000seq-1.13 %0.09270
benchmark_partial_sort_parallel
hpx::partial_sort, size: 1000, step: 1par1.62 %0.10247
hpx::partial_sort, size: 100000, step: 1000par10.23 %0.05292
benchmark_nth_element_parallel
hpx::nth_element, size: 100000, step: 5000par0.70 %0.39393

@codacy-production

codacy-production Bot commented Aug 15, 2024 •

Copy link
Copy Markdown

Coverage summary from Codacy

See diff coverage on Codacy

Coverage variation Diff coverage
✅ -0.06% ✅ 86.70%
Coverage variation details
Coverable lines Covered lines Coverage
Common ancestor commit (17bbc63) 222489 189245 85.06%
Head commit (ff62d46) 196730 (-25759) 167219 (-22026) 85.00% (-0.06%)

Coverage variation is the difference between the coverage for the head and common ancestor commits of the pull request branch: <coverage of head commit> - <coverage of common ancestor commit>

Diff coverage details
Coverable lines Covered lines Diff coverage
Pull request (#6514) 436 378 86.70%

Diff coverage is the percentage of lines that are covered by tests out of the coverable lines that the pull request added or modified: <covered lines added or modified>/<coverable lines added or modified> * 100%

See your quality gate settings    Change summary preferences

Codacy stopped sending the deprecated coverage status on June 5th, 2024. Learn more

@StellarBot

Copy link
Copy Markdown
Collaborator
Performance test report
Test nameExecutorMean Percentage Diff.Coefficient of variation
minmax_element_performance
hpx::minmaxpar4.10 %0.33835
hpx::minpar2.22 %0.47294
future_overhead_report
future overhead - create_thread_hierarchical - latchno-executor-2.48 %1.14423
stream_report
Stream benchmark - Scaleparallel_executor_default_parallel_policy_allocator5.08 %0.18510
stream benchmark - Copyscheduler_executor_default_scheduler_executor_allocator-5.06 %0.41326
Stream benchmark - Scalescheduler_executor_default_scheduler_executor_allocator2.40 %0.24650
Stream benchmark - Addscheduler_executor_default_scheduler_executor_allocator1.53 %0.32002
transform_reduce_scaling
transform_reducepar0.72 %1.15210
transform_reduce_oldpar1.19 %0.33932
benchmark_is_heap_until
hpx::heap_untilpar5.66 %0.26522
benchmark_merge
hpx::mergeseq1.49 %0.02982
hpx::mergepar-0.84 %0.47515
hpx::mergepar_unseq-1.12 %0.38487
benchmark_inplace_merge
hpx::inplace_mergepar8.98 %0.16203
hpx::inplace_mergepar_unseq10.69 %0.08418
benchmark_is_heap
hpx::is_heappar5.14 %0.34268
benchmark_remove
hpx::removeseq1.01 %0.11027
benchmark_remove_if
hpx::remove_ifseq0.89 %0.10283
benchmark_partial_sort
hpx::partial_sort, size: 1000, step: 1seq4.11 %0.02851
hpx::partial_sort, size: 100000seq-1.11 %0.09047
benchmark_partial_sort_parallel
hpx::partial_sort, size: 1000, step: 1par-5.42 %0.02644
hpx::partial_sort, size: 100000par5.34 %0.04335
hpx::partial_sort, size: 100000, step: 1000par7.37 %0.06949

@StellarBot

Copy link
Copy Markdown
Collaborator
Performance test report
Test nameExecutorMean Percentage Diff.Coefficient of variation
minmax_element_performance
hpx::minpar-1.25 %0.45074
future_overhead_report
future overhead - create_thread_hierarchical - latchno-executor9.20 %0.25129
stream_report
Stream benchmark - Addparallel_executor_default_parallel_policy_allocator1.03 %0.30720
Stream benchmark - Triadparallel_executor_default_parallel_policy_allocator0.91 %0.36907
stream benchmark - Copyscheduler_executor_default_scheduler_executor_allocator3.72 %0.78148
Stream benchmark - Triadscheduler_executor_default_scheduler_executor_allocator1.53 %0.22015
benchmark_merge
hpx::mergepar0.55 %0.47600
benchmark_inplace_merge
hpx::inplace_mergepar0.34 %3.88061
hpx::inplace_mergepar_unseq1.05 %1.06177
benchmark_is_heap
hpx::is_heappar0.56 %1.41438
benchmark_remove
hpx::removepar_unseq-0.72 %1.45818
benchmark_remove_if
hpx::remove_ifpar_unseq0.10 %10.37297
benchmark_partial_sort
hpx::partial_sort, size: 1000, step: 1seq1.52 %0.07678
benchmark_partial_sort_parallel
hpx::partial_sort, size: 1000, step: 1par6.47 %0.04699
hpx::partial_sort, size: 100000par2.04 %0.11232
benchmark_nth_element_parallel
hpx::nth_element, size: 1000, step: 1par-6.31 %0.93441
hpx::nth_element, size: 100000, step: 5000par0.23 %5.23035

@StellarBot

Copy link
Copy Markdown
Collaborator
Performance test report
Test nameExecutorMean Percentage Diff.Coefficient of variation
minmax_element_performance
hpx::maxpar0.75 %0.71582
small_vector_benchmark
hpx::small_vector<int, 2>-1.09 %0.43155
hpx::small_vector<int, 4>-1.00 %0.21861
hpx::small_vector<int, 16>1.39 %0.00417
hpx::small_vector<fxn<void()>, 1>2.63 %0.03075
hpx::small_vector<fxn<void()>, 2>1.55 %0.05928
hpx::small_vector<fxn<void()>, 4>4.30 %0.00848
hpx::small_vector<fxn<void()>, 8>1.35 %0.04220
hpx::small_vector<fxn<void()>, 16>3.77 %0.00194
future_overhead_report
future overhead - create_thread_hierarchical - latchno-executor7.44 %0.25946
stream_report
stream benchmark - Copyparallel_executor_default_parallel_policy_allocator-1.26 %0.45600
Stream benchmark - Addparallel_executor_default_parallel_policy_allocator0.53 %0.20760
Stream benchmark - Triadparallel_executor_default_parallel_policy_allocator0.67 %0.19165
stream benchmark - Copyscheduler_executor_default_scheduler_executor_allocator2.15 %0.16984
Stream benchmark - Addscheduler_executor_default_scheduler_executor_allocator1.14 %0.74768
Stream benchmark - Triadscheduler_executor_default_scheduler_executor_allocator0.77 %0.24945
transform_reduce_scaling
transform_reducepar-0.52 %0.43732
transform_reduce_oldpar-0.67 %0.32381
benchmark_is_heap_until
hpx::heap_untilseq16.66 %0.00071
benchmark_merge
hpx::mergepar1.20 %0.24594
hpx::mergepar_unseq1.23 %0.30648
benchmark_inplace_merge
hpx::inplace_mergeseq0.39 %0.16341
hpx::inplace_mergepar-7.56 %0.08207
hpx::inplace_mergepar_unseq-9.89 %0.05748
benchmark_is_heap
hpx::is_heapseq16.64 %0.00047
hpx::is_heappar-0.02 %3.44765
benchmark_remove
hpx::removepar_unseq-1.22 %0.02323
benchmark_partial_sort
hpx::partial_sort, size: 1000, step: 1seq5.18 %0.01505
benchmark_partial_sort_parallel
hpx::partial_sort, size: 1000, step: 1par7.42 %0.01615
hpx::partial_sort, size: 100000par3.74 %0.06045
hpx::partial_sort, size: 100000, step: 1000par-2.06 %0.02687

@StellarBot

Copy link
Copy Markdown
Collaborator
Performance test report
Test nameExecutorPercentage Diff.Classification
future_overhead_report
future overhead - create_thread_hierarchical - latchno-executor1.57 %?
stream_report
Stream benchmark - Triadparallel_executor_default_parallel_policy_allocator2.32 %-
stream benchmark - Copyscheduler_executor_default_scheduler_executor_allocator5.63 %--
Stream benchmark - Scalescheduler_executor_default_scheduler_executor_allocator1.54 %-
Stream benchmark - Addscheduler_executor_default_scheduler_executor_allocator1.31 %-
Stream benchmark - Triadscheduler_executor_default_scheduler_executor_allocator1.89 %-
benchmark_is_heap_until
hpx::heap_untilseq16.65 %---
benchmark_inplace_merge
hpx::inplace_mergepar0.77 %?
hpx::inplace_mergepar_unseq-1.58 %+
benchmark_is_heap
hpx::is_heapseq16.66 %---
hpx::is_heappar0.21 %?
benchmark_partial_sort_parallel
hpx::partial_sort, size: 100000par3.07 %-
hpx::partial_sort, size: 100000, step: 1000par-3.09 %+
benchmark_nth_element_parallel
hpx::nth_element, size: 1000, step: 1par-15.38 %+++
hpx::nth_element, size: 100000, step: 5000par-7.18 %++

@StellarBot

Copy link
Copy Markdown
Collaborator
Performance test report
Test nameExecutorPercentage Diff.Classification
minmax_element_performance
hpx::minmaxpar-0.74 %?
hpx::maxpar-1.84 %+
small_vector_benchmark
hpx::small_vectorint, 12.99 %-
hpx::small_vectorint, 2-1.51 %+
hpx::small_vectorint, 42.69 %-
hpx::small_vectorint, 815.83 %---
hpx::small_vectorint, 1635.71 %---
hpx::small_vectorfxn:void(), 17.22 %--
hpx::small_vectorfxn:void(), 26.00 %--
hpx::small_vectorfxn:void(), 45.38 %--
hpx::small_vectorfxn:void(), 88.88 %--
future_overhead_report
future overhead - create_thread_hierarchical - latchno-executor1.51 %?
stream_report
Stream benchmark - Addparallel_executor_default_parallel_policy_allocator1.55 %-
Stream benchmark - Triadparallel_executor_default_parallel_policy_allocator2.98 %-
stream benchmark - Copyscheduler_executor_default_scheduler_executor_allocator6.43 %--
Stream benchmark - Scalescheduler_executor_default_scheduler_executor_allocator1.30 %?
Stream benchmark - Addscheduler_executor_default_scheduler_executor_allocator2.28 %-
Stream benchmark - Triadscheduler_executor_default_scheduler_executor_allocator2.07 %-
foreach_report
for_eachparallel_executor-0.02 %(+)
benchmark_is_heap_until
hpx::heap_untilseq16.65 %---
benchmark_merge
hpx::mergepar-3.96 %+
benchmark_inplace_merge
hpx::inplace_mergepar1.18 %?
hpx::inplace_mergepar_unseq-1.16 %+
benchmark_is_heap
hpx::is_heapseq16.65 %---
hpx::is_heappar-3.49 %++
benchmark_partial_sort_parallel
hpx::partial_sort, size: 100000par2.79 %-
hpx::partial_sort, size: 100000, step: 1000par2.29 %-
benchmark_nth_element_parallel
hpx::nth_element, size: 1000, step: 1par-17.33 %+++
hpx::nth_element, size: 100000, step: 5000par-8.50 %++

@hkaiser
hkaiser force-pushed the cdash_perftest_bench branch 2 times, most recently from 35e18b4 to 048a707 Compare October 21, 2026 13:51
@hkaiser

hkaiser commented Oct 21, 2026

Copy link
Copy Markdown
Contributor

@vrnimje In case you're still interested in this work. I think things stabilize now and I plan to merge the overall result soon. Please have a look and comment, if you like.

@StellarBot

Copy link
Copy Markdown
Collaborator

Commit 048a707cd13484a43fdc06254e533fb7f1b07f5b, Jenkins build 6113

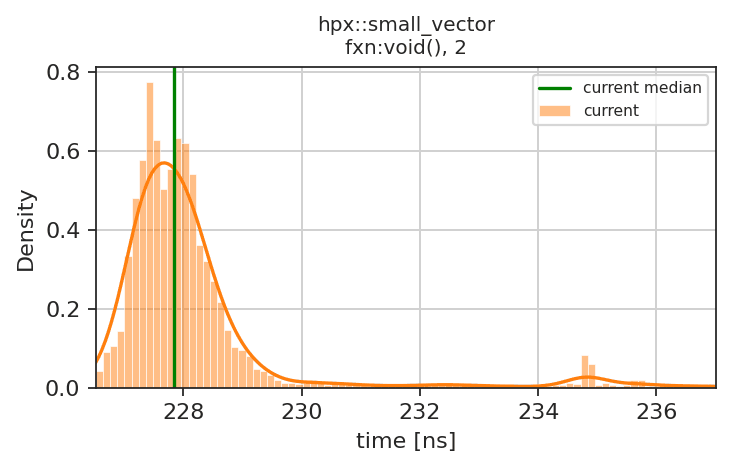
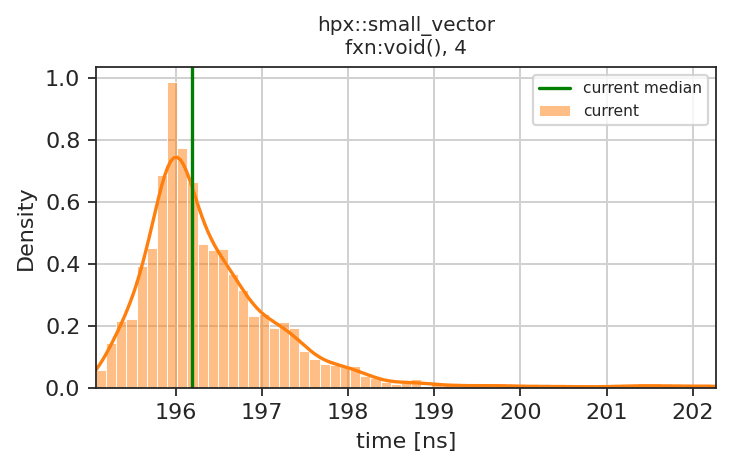
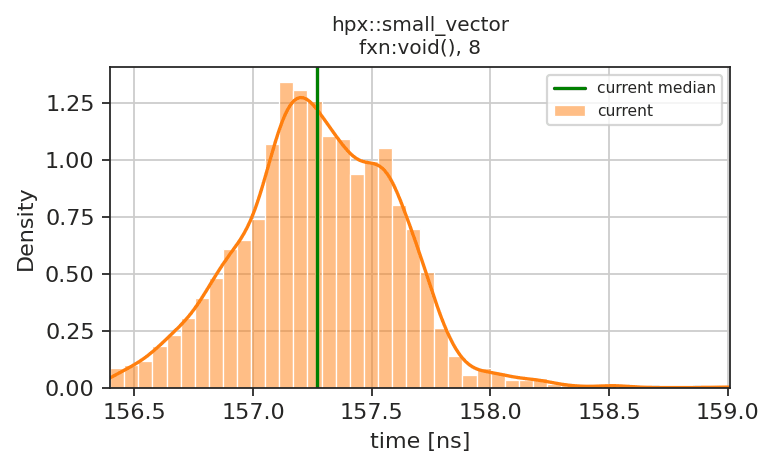
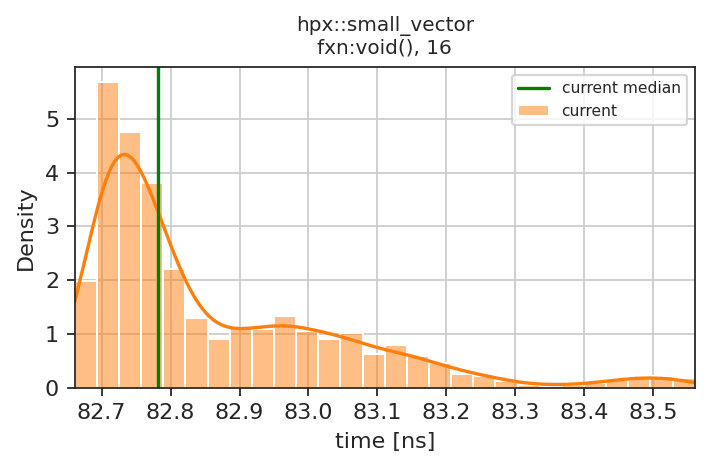
Performance test report
PropertyReferenceCurrent
Run date2026-10-21T07:02:15.929664-05:002026-10-21T09:12:12.816974-05:00
Hostmedusa08.rostam.cct.lsu.edumedusa08.rostam.cct.lsu.edu
Compiler/opt/apps/llvm/18.1.8/bin/clang++/opt/apps/llvm/18.1.8/bin/clang++
Test nameExecutorPercentage Diff.Classification
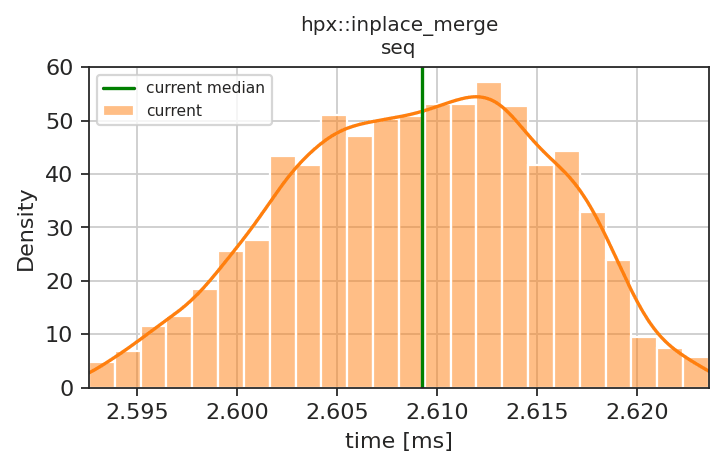
benchmark_inplace_merge
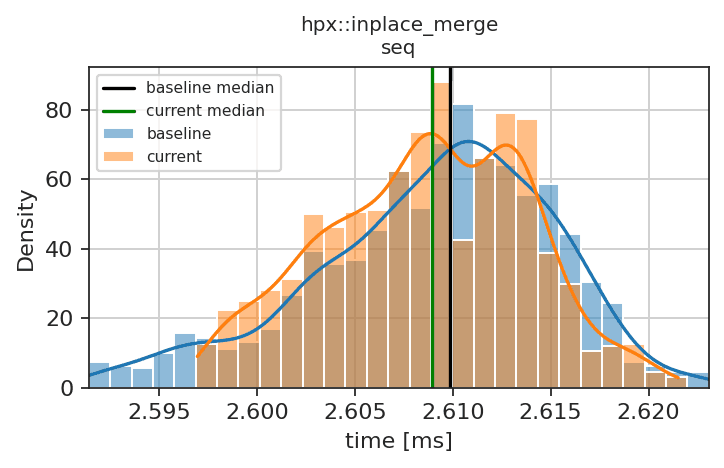
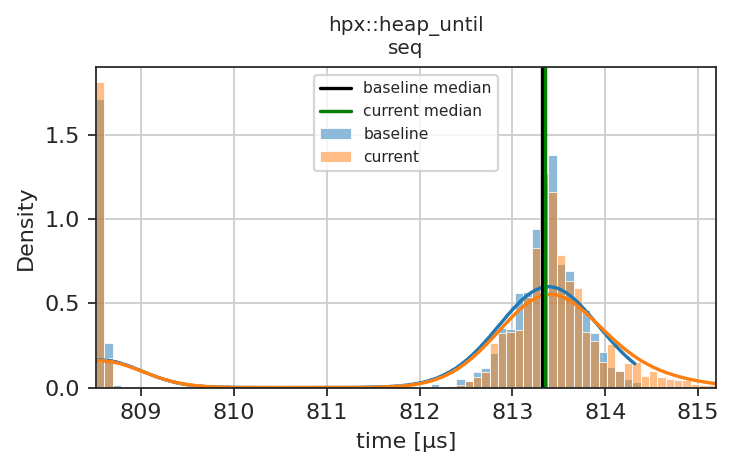
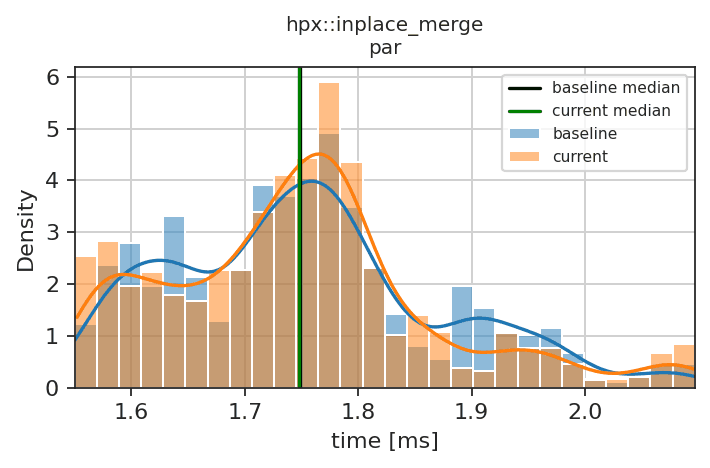
hpx::inplace_mergeseq0.04 %(+)
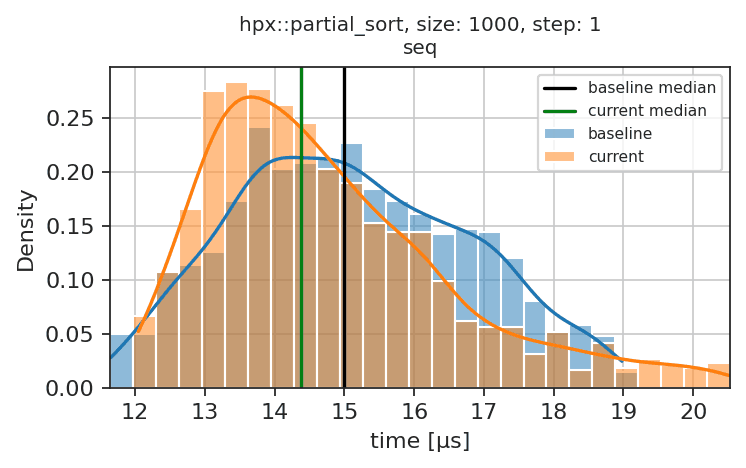
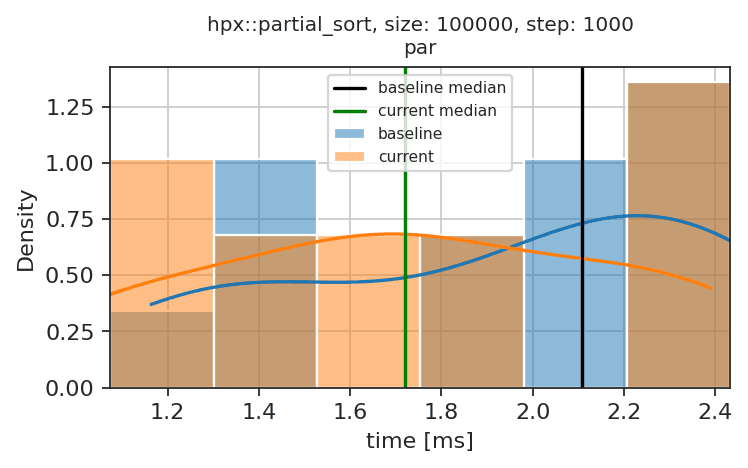
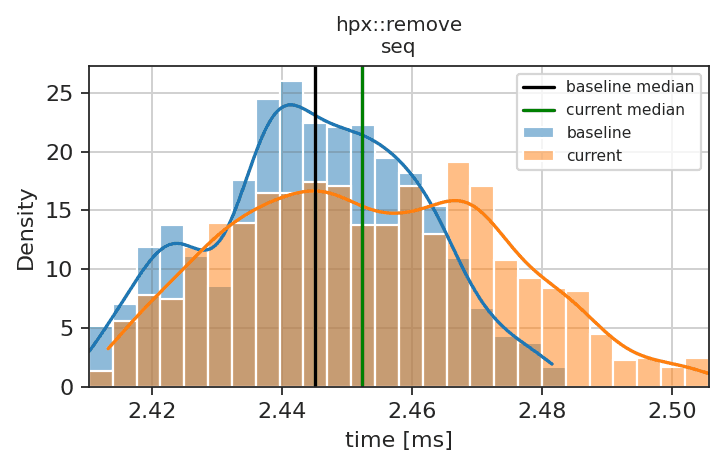
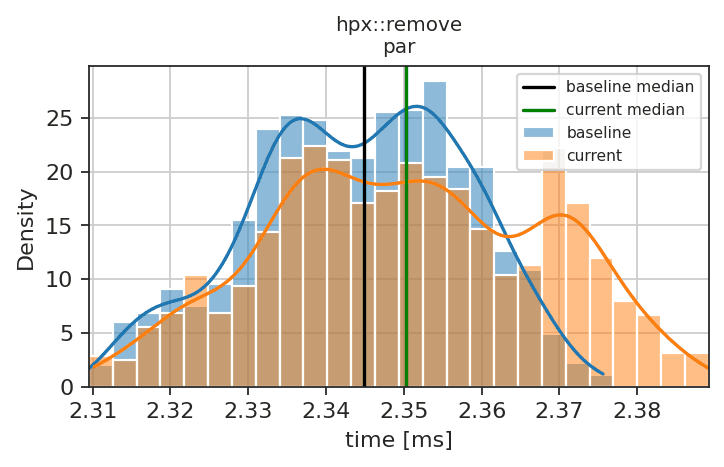
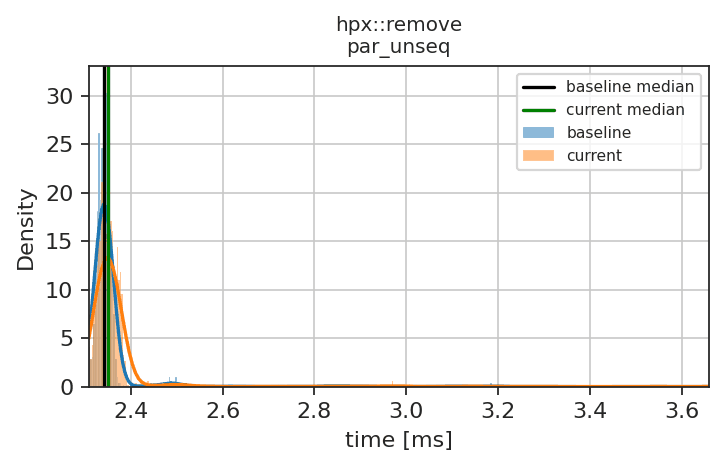
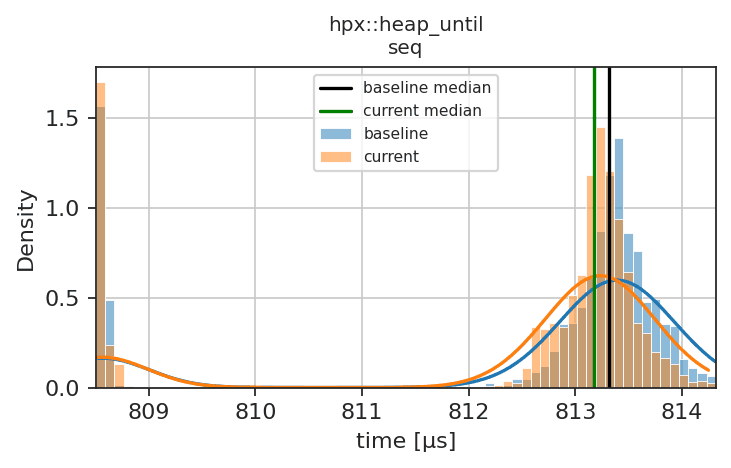
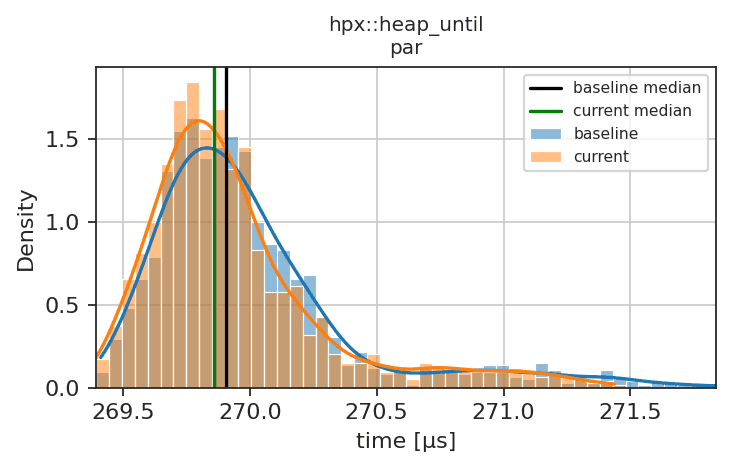
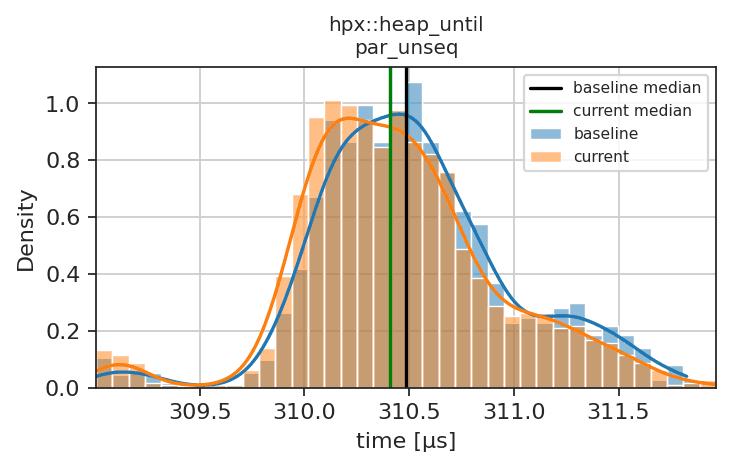
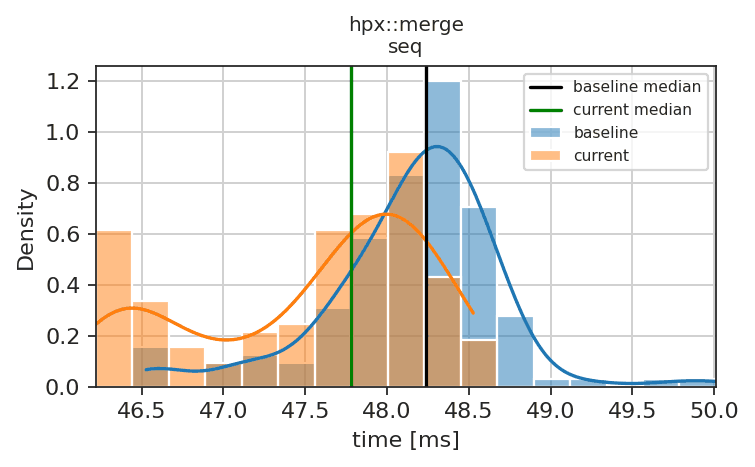
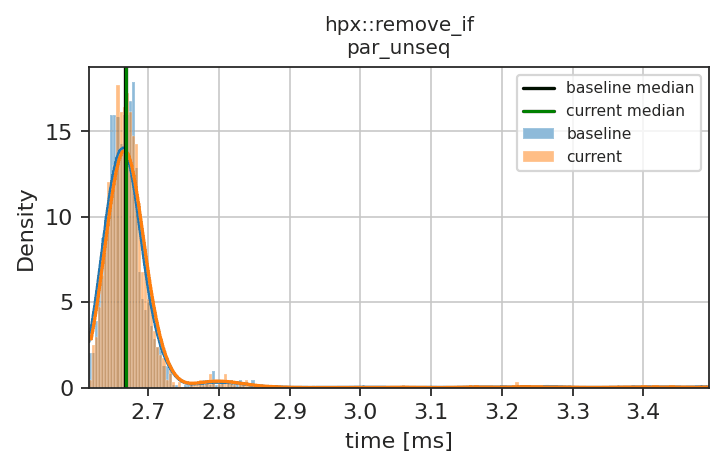
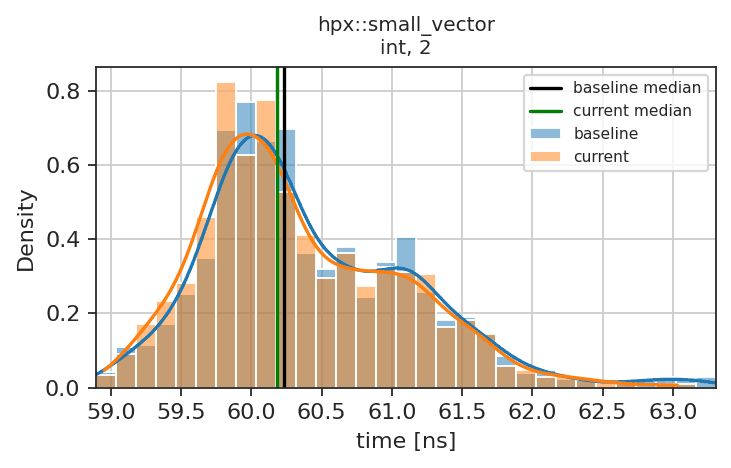
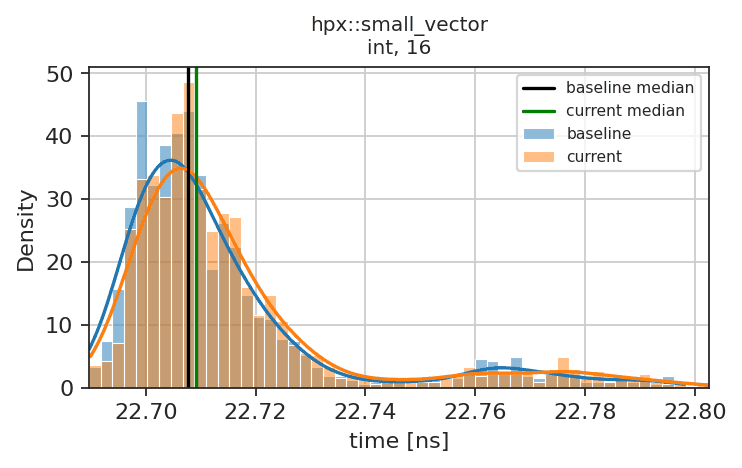
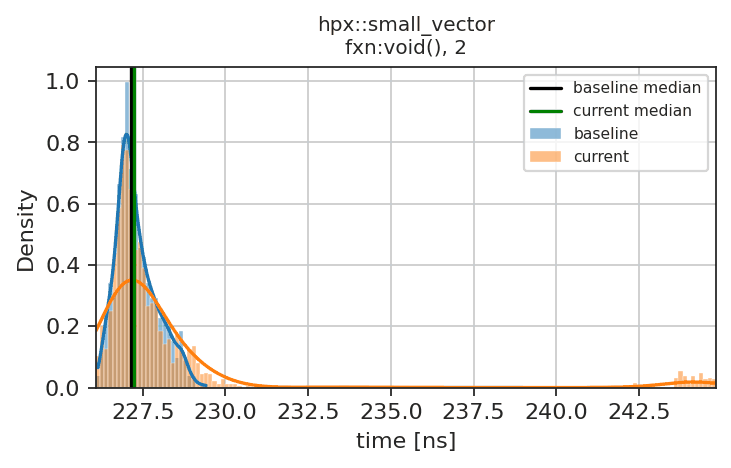
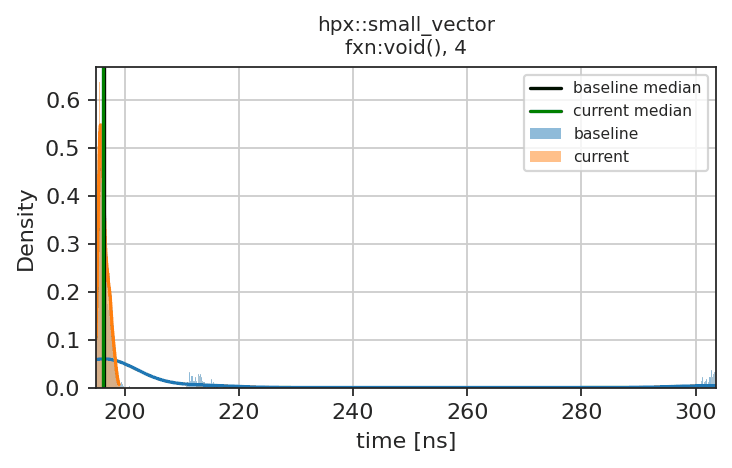
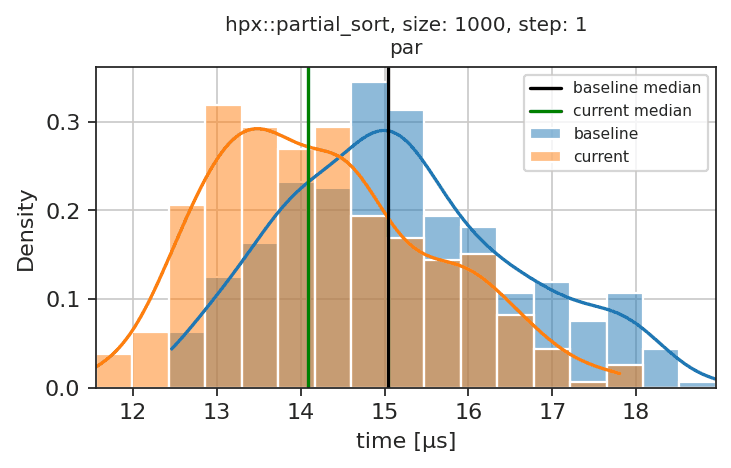
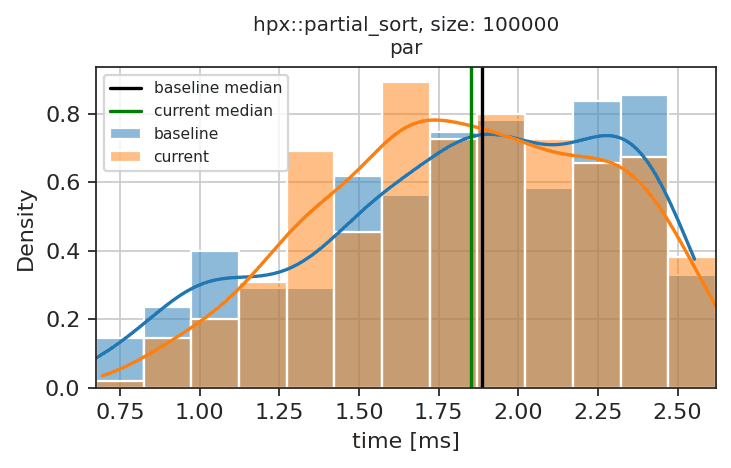
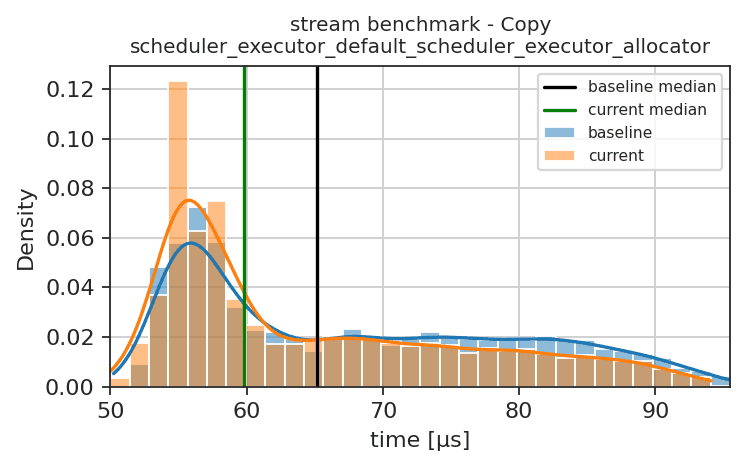
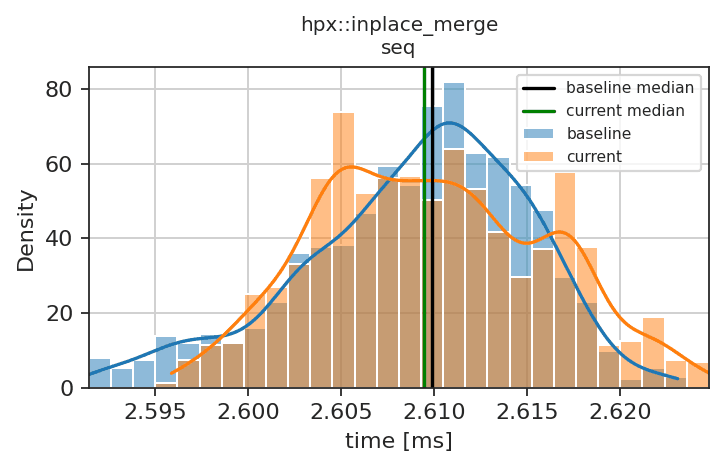
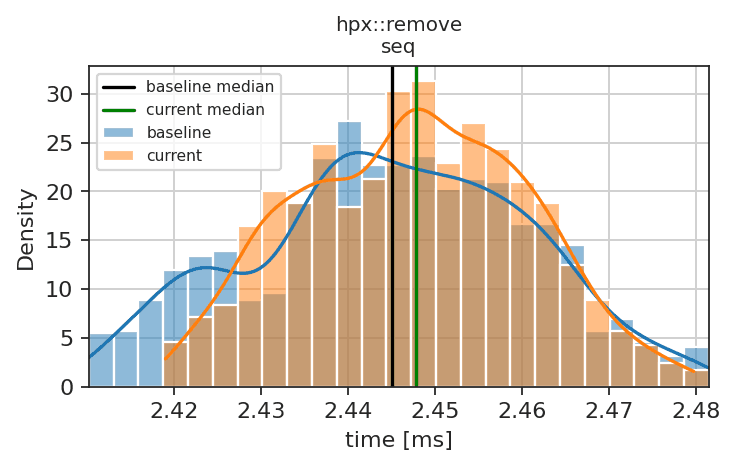
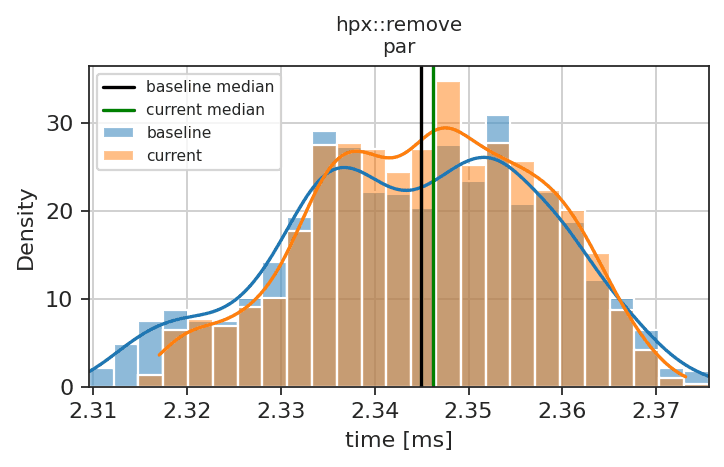
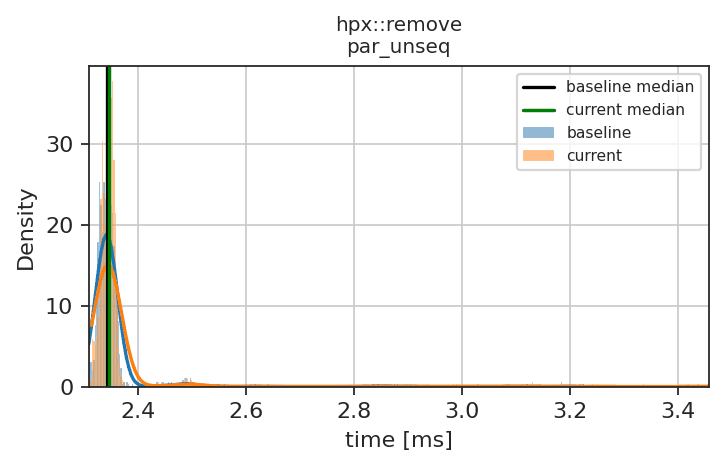
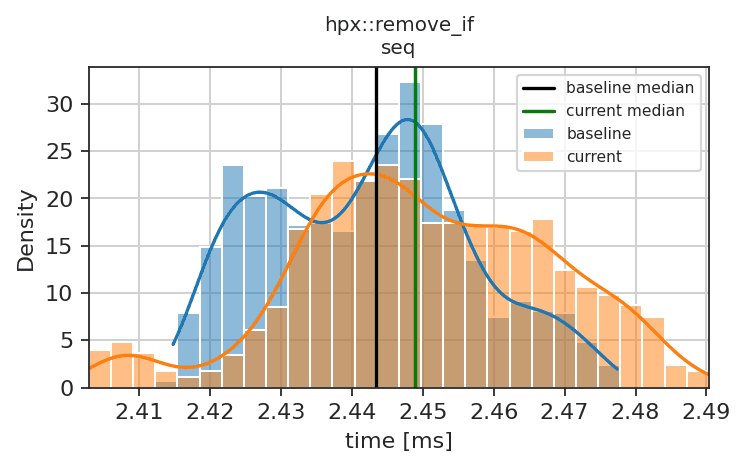
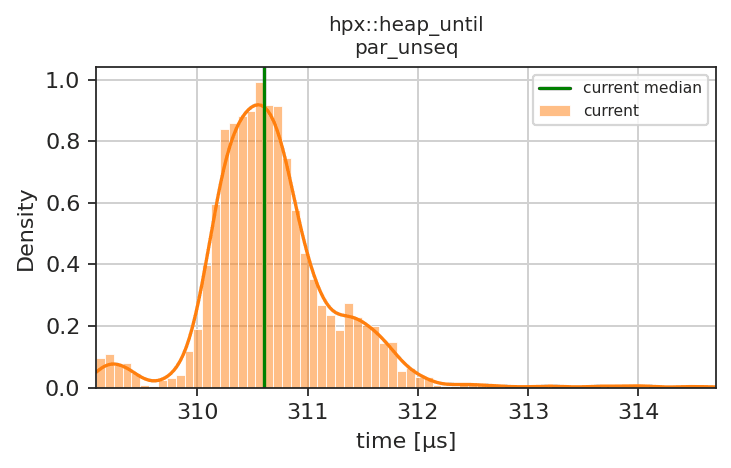
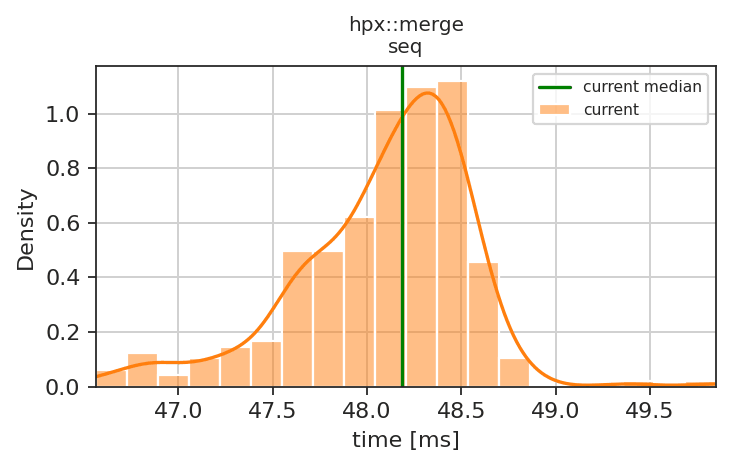
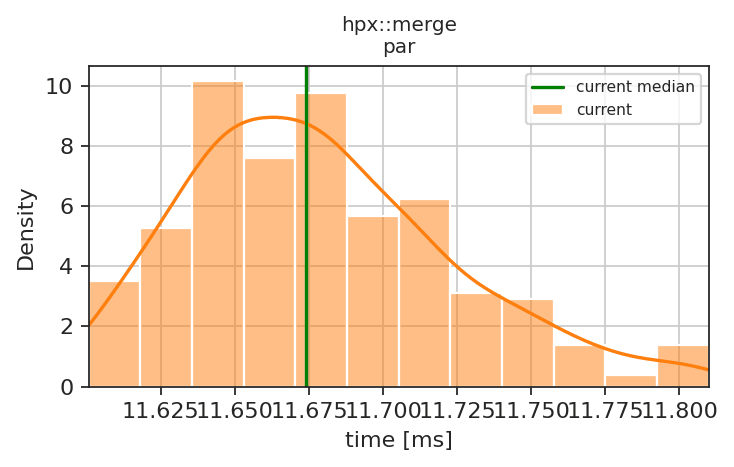
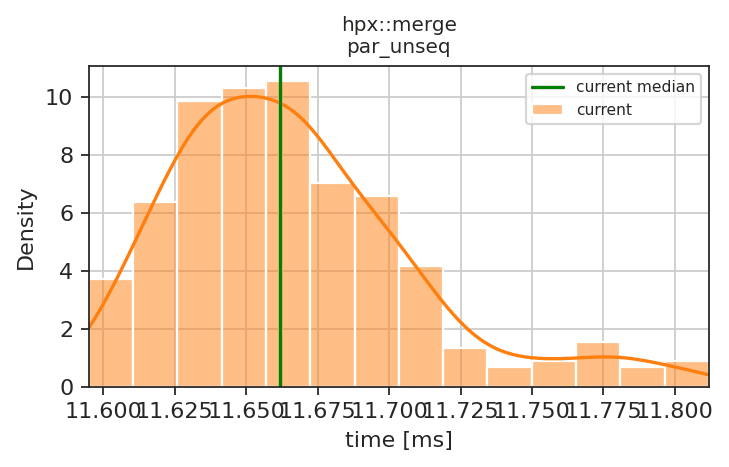
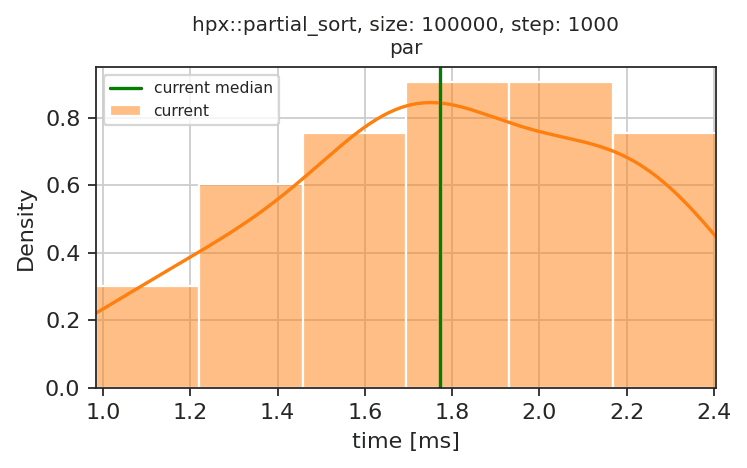
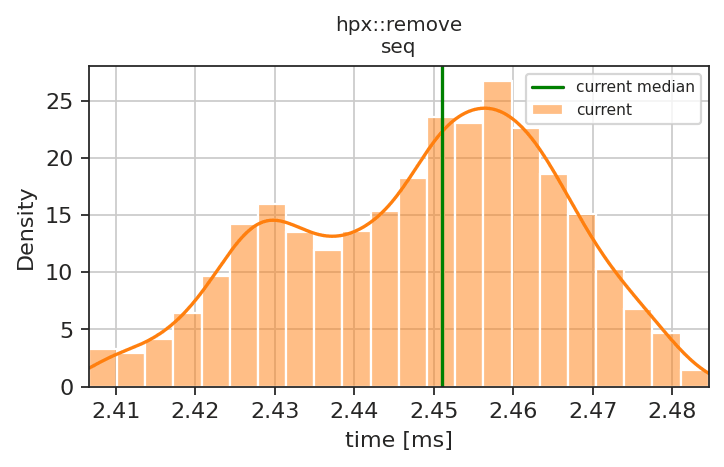
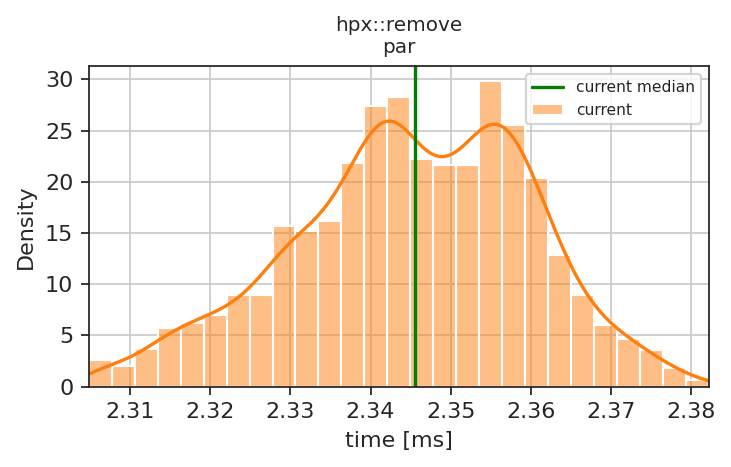
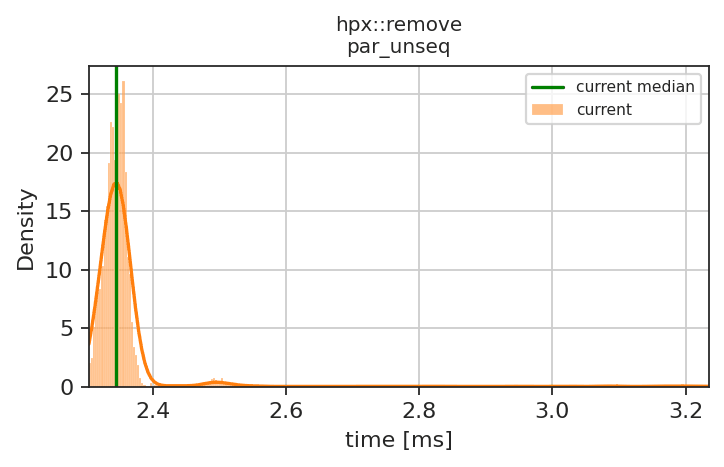
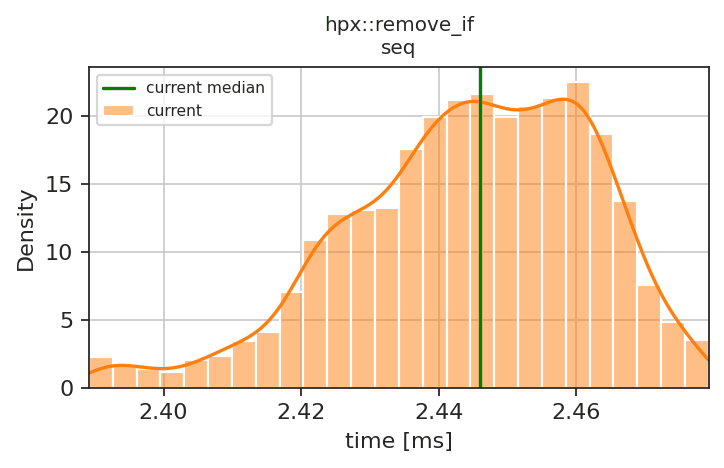
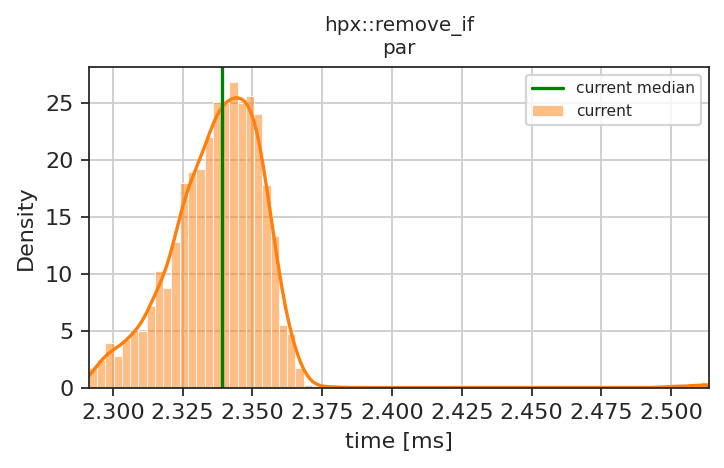
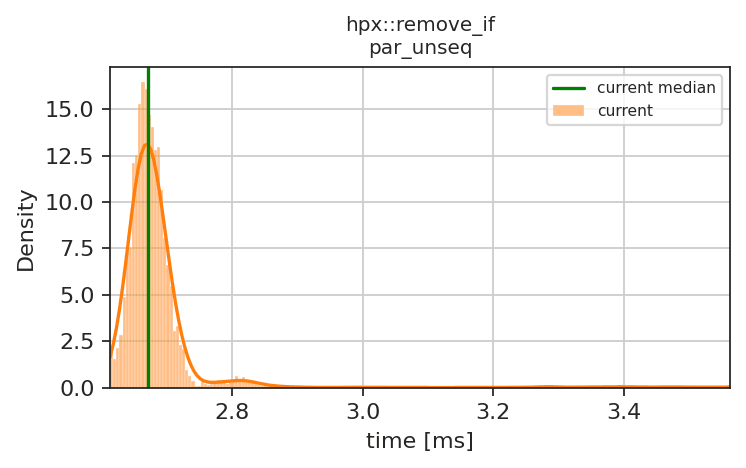
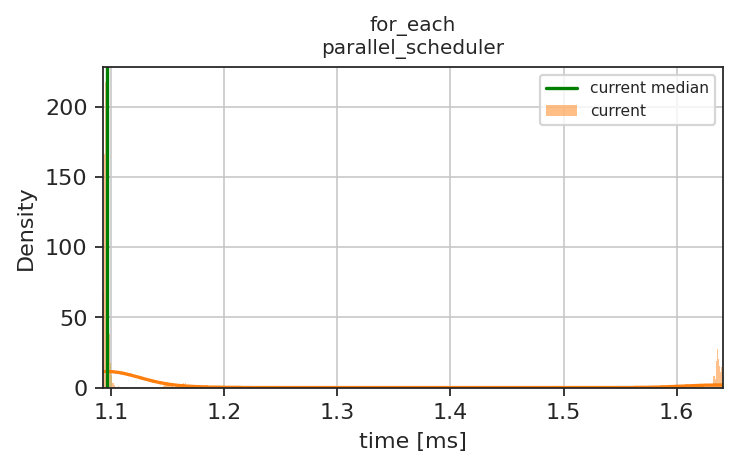
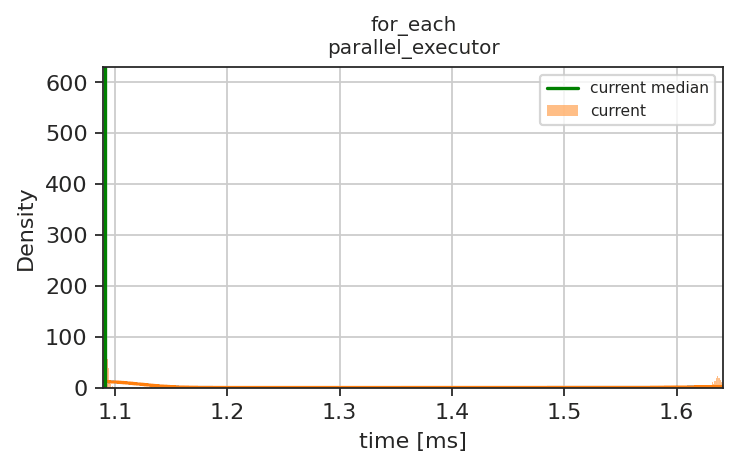
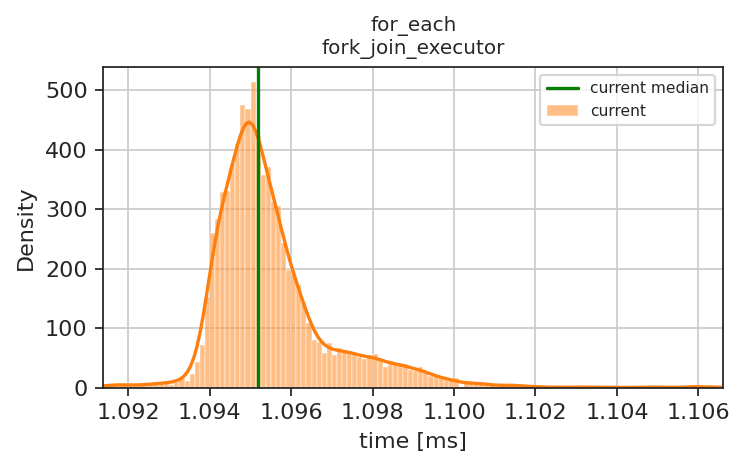
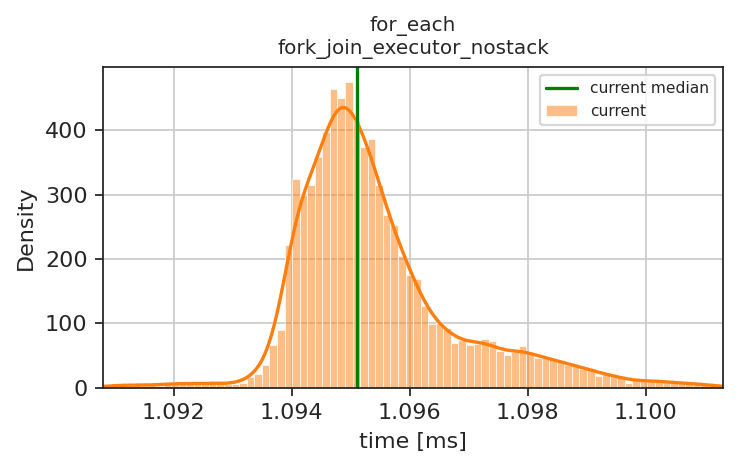
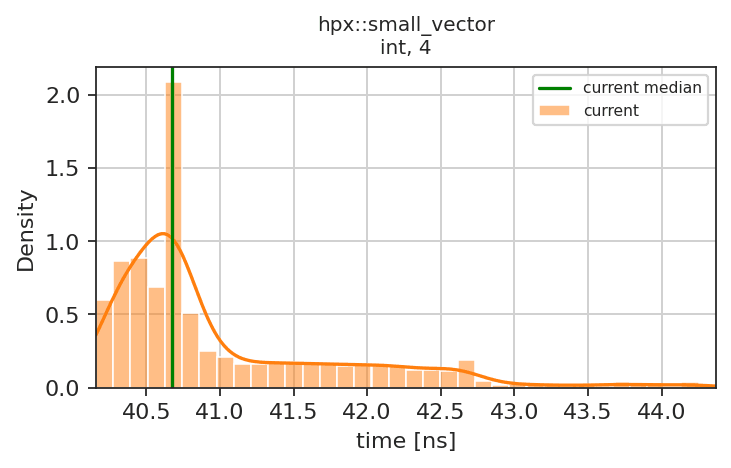
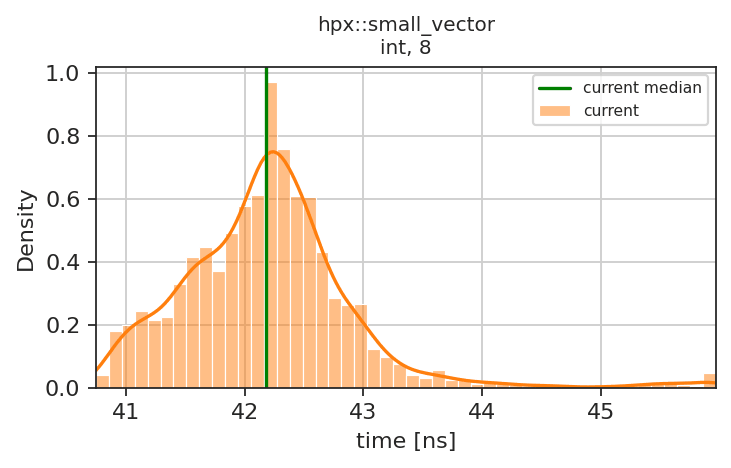
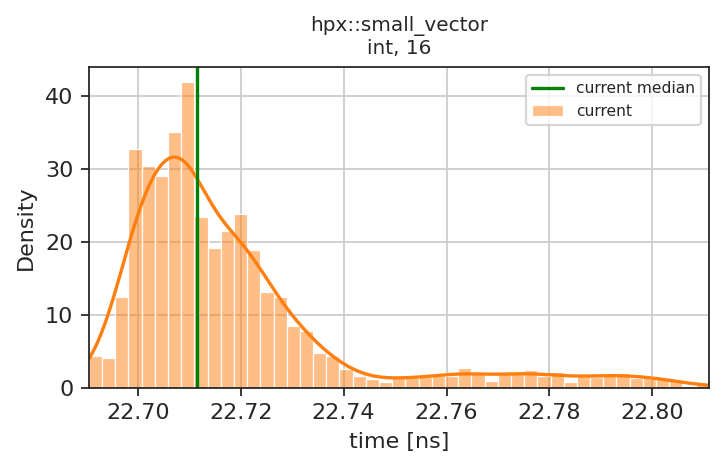
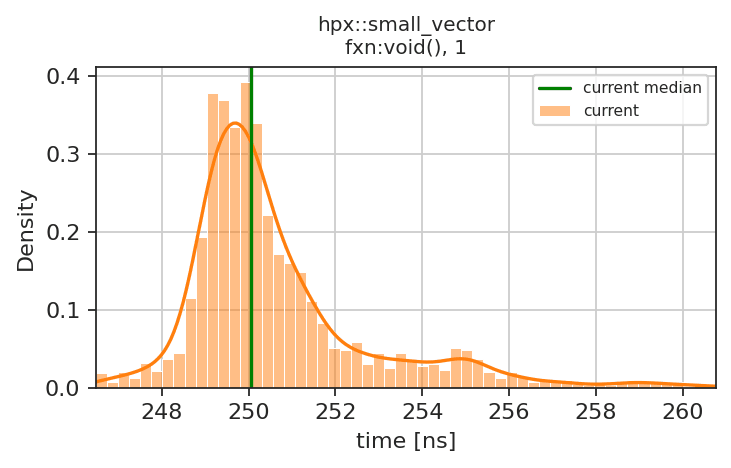
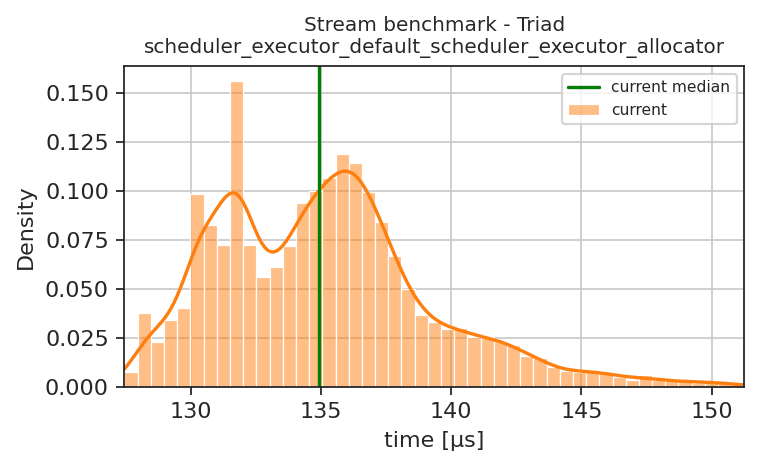
Plot
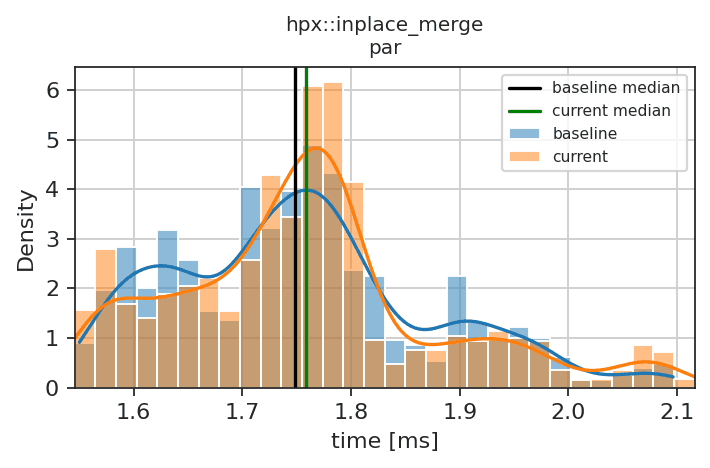
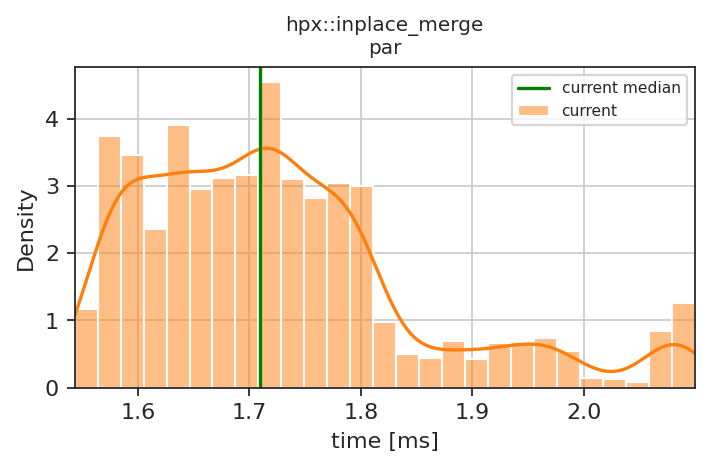
hpx::inplace_mergepar-0.57 %-
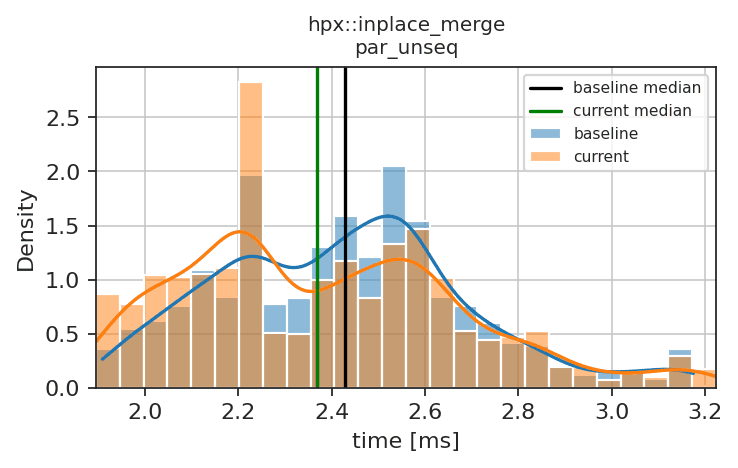
Plot
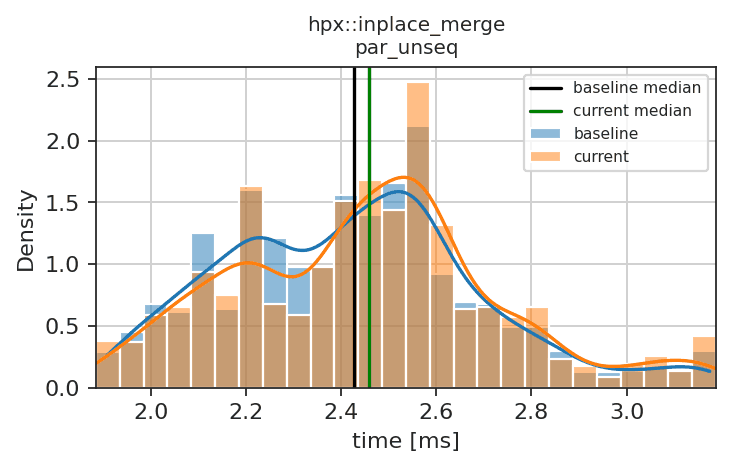
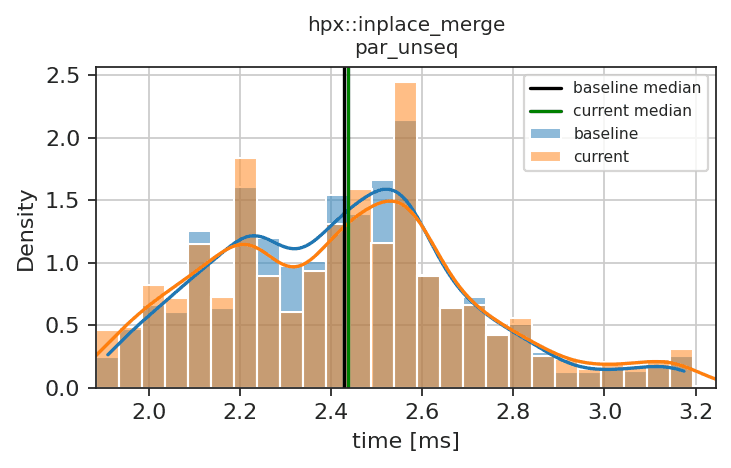
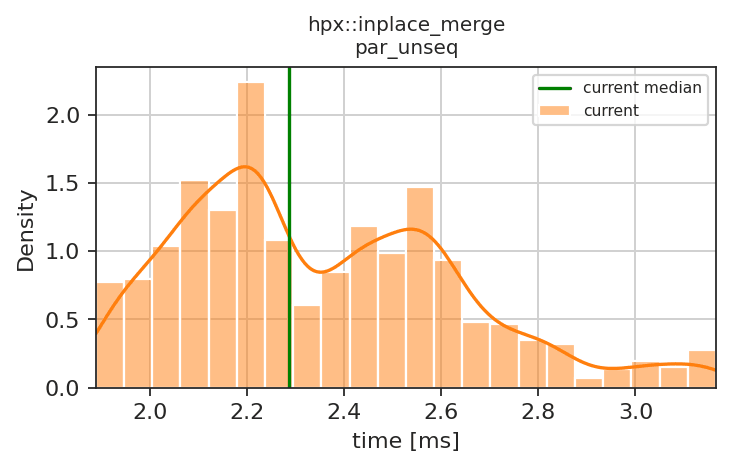
hpx::inplace_mergepar_unseq-1.28 %-
Plot
benchmark_is_heap
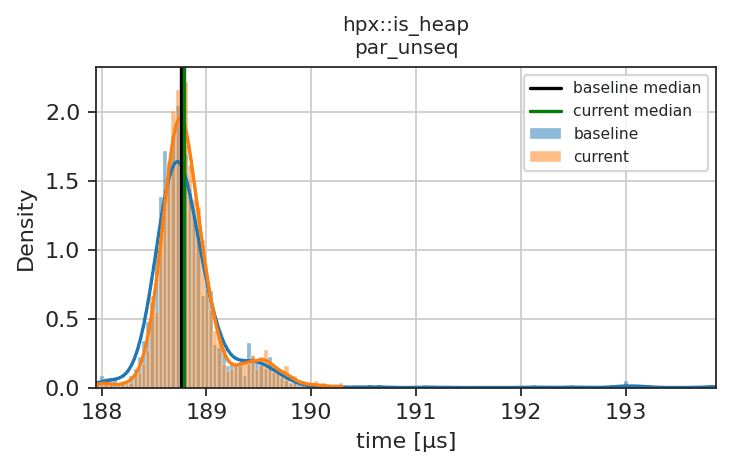
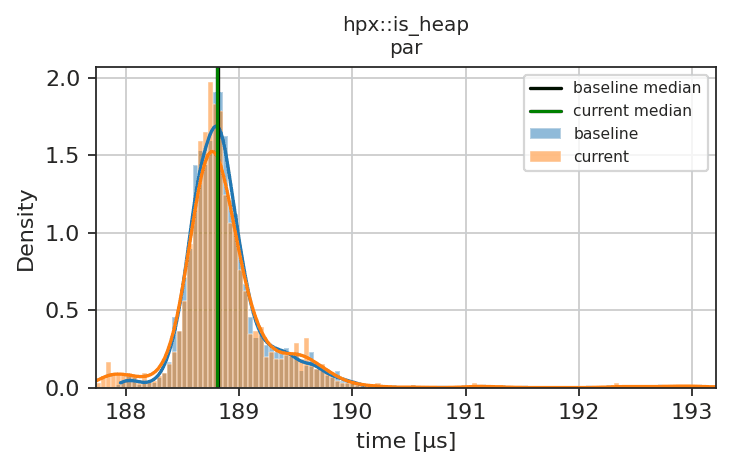
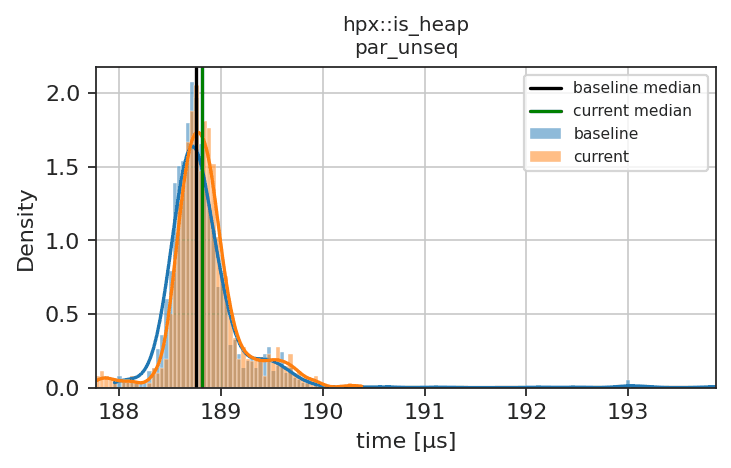
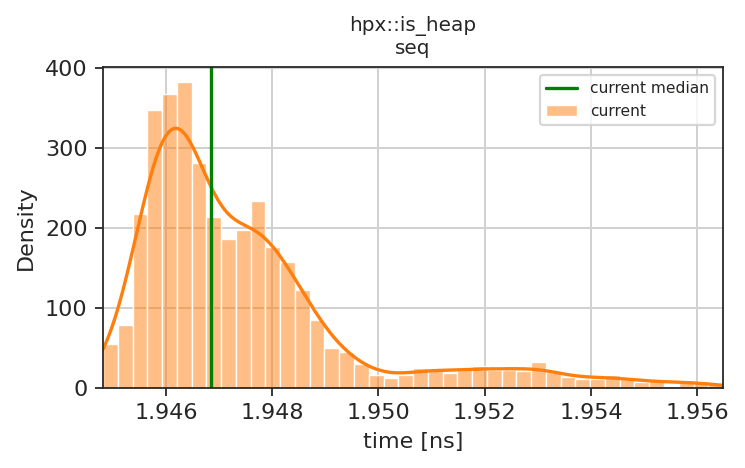
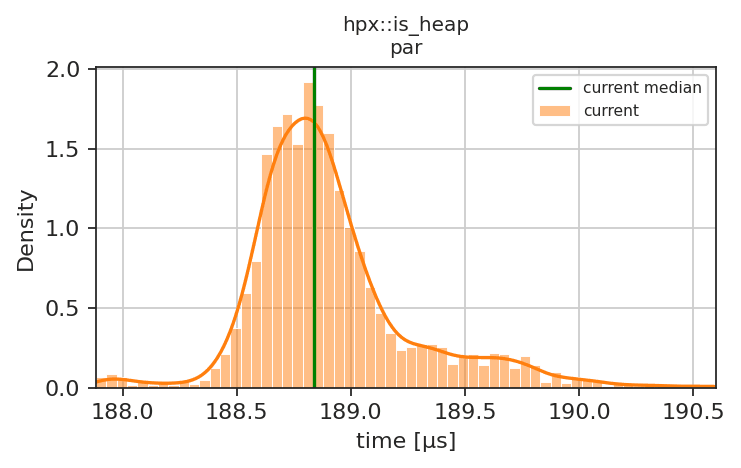
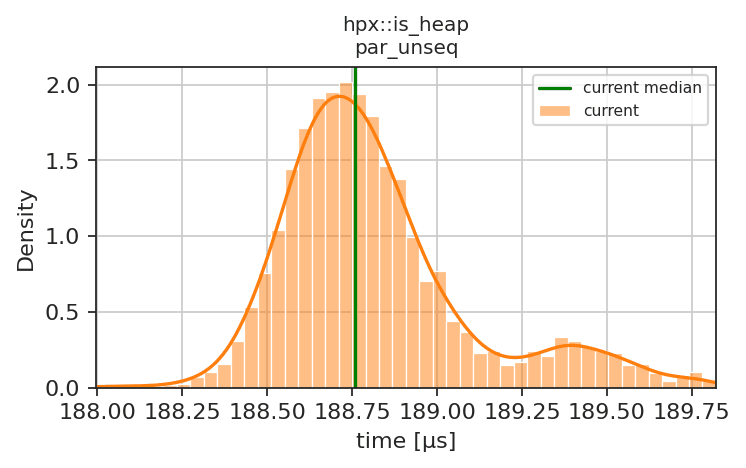
hpx::is_heappar_unseq-0.01 %(-)
Plot
benchmark_is_heap_until
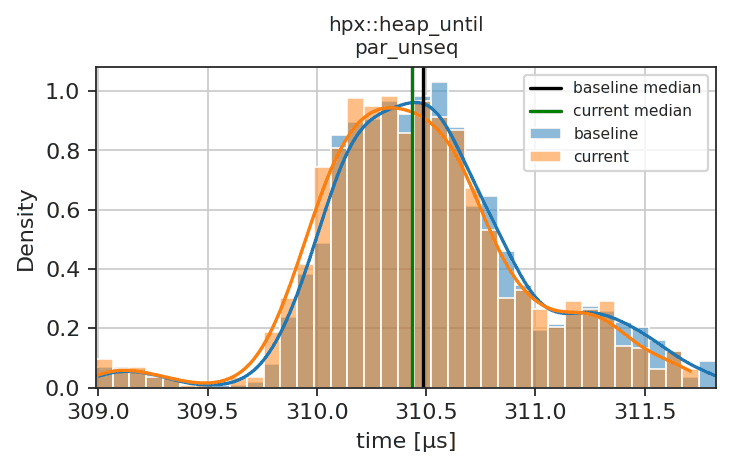
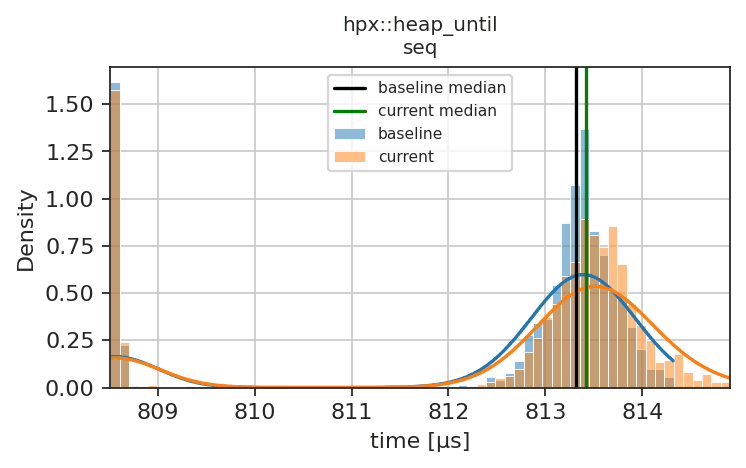
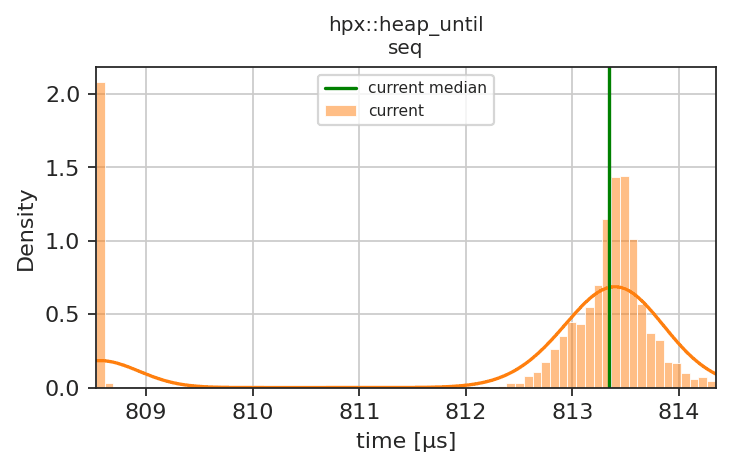
hpx::heap_untilseq-0.00 %(-)
Plot
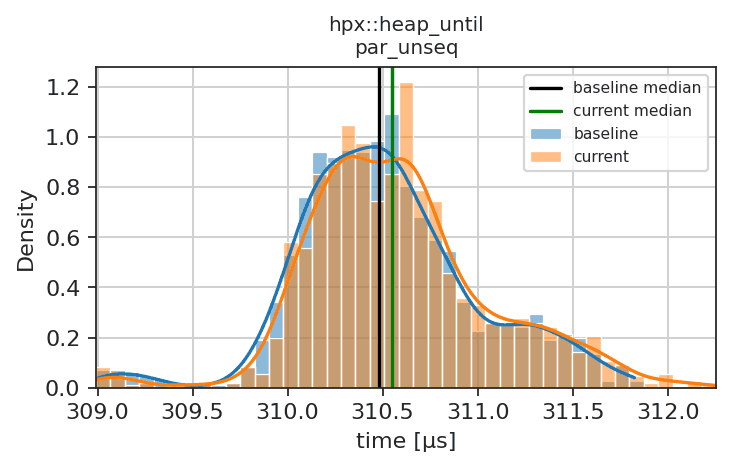
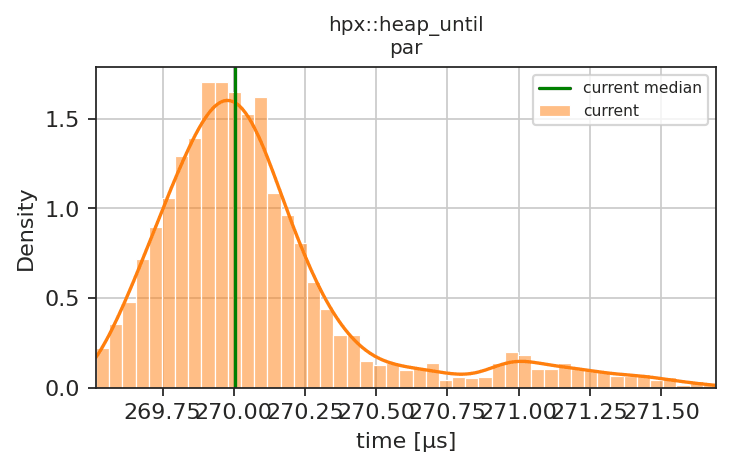
hpx::heap_untilpar_unseq0.02 %(+)
Plot
benchmark_nth_element
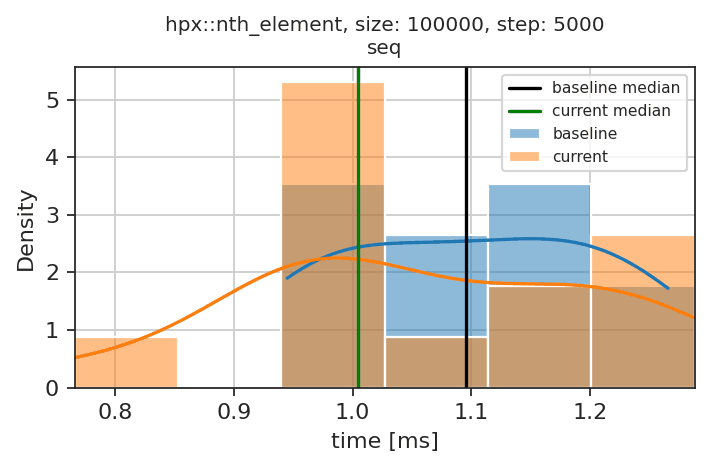
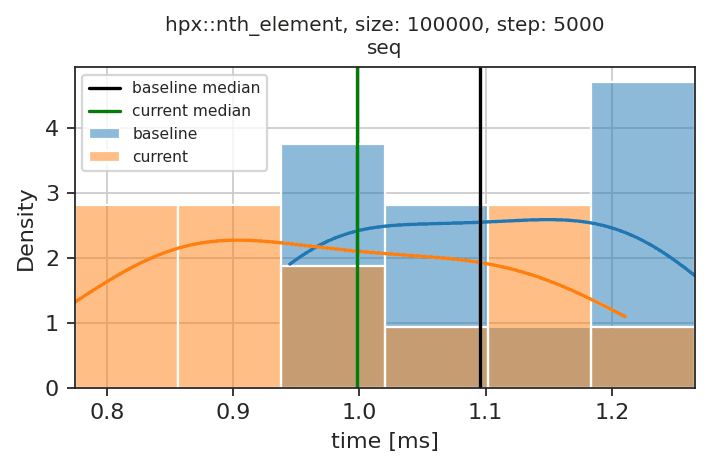
hpx::nth_element, size: 100000, step: 5000seq8.35 %??
Plot
benchmark_nth_element_parallel
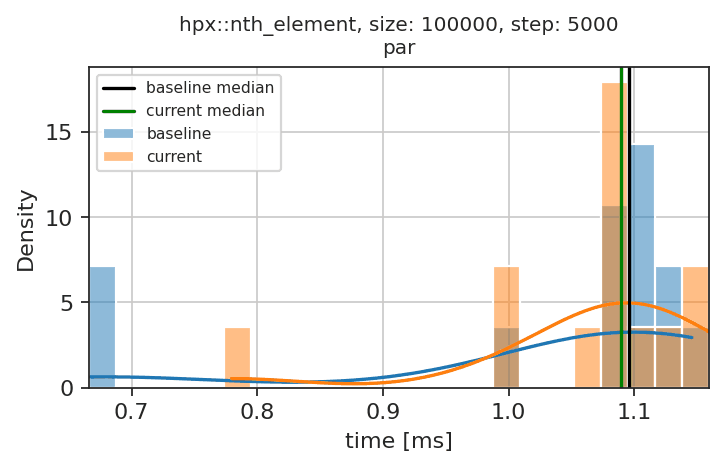
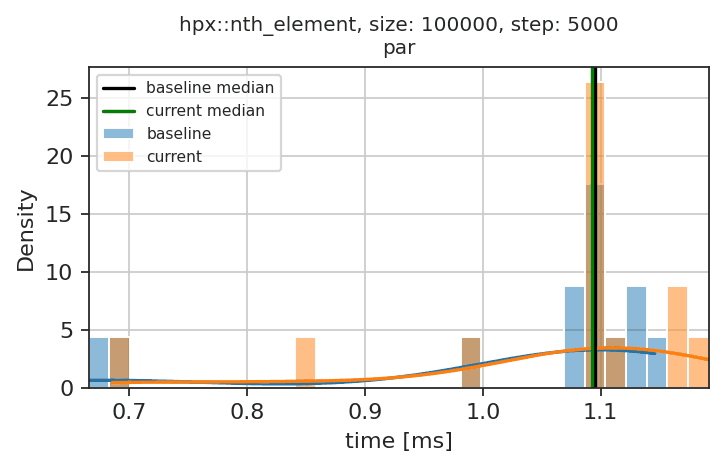
hpx::nth_element, size: 100000, step: 5000par0.53 %??
Plot
benchmark_partial_sort
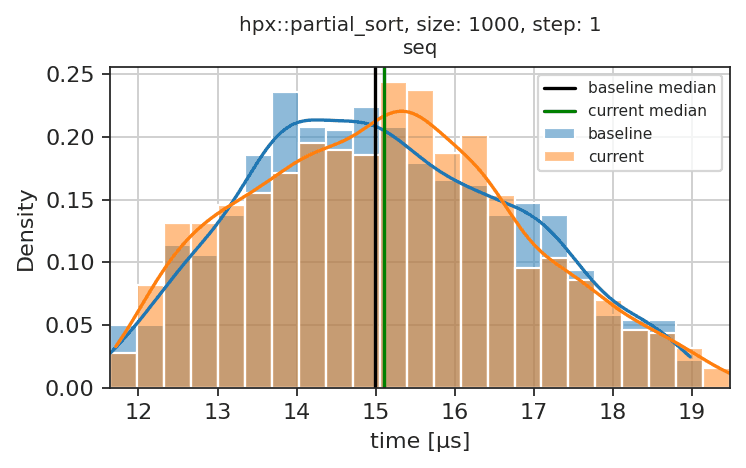
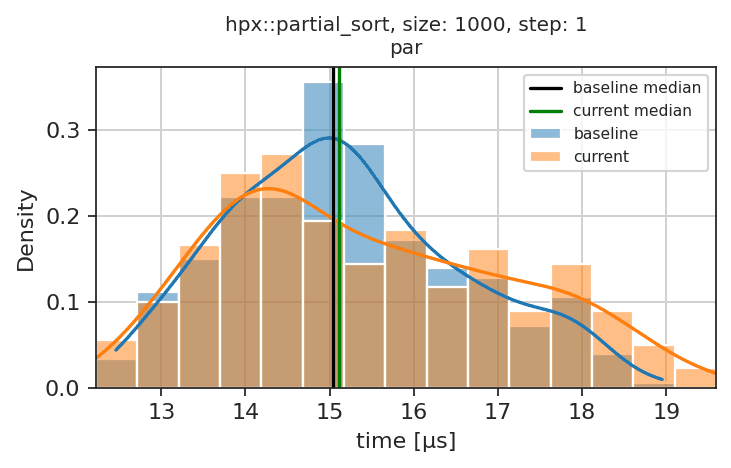
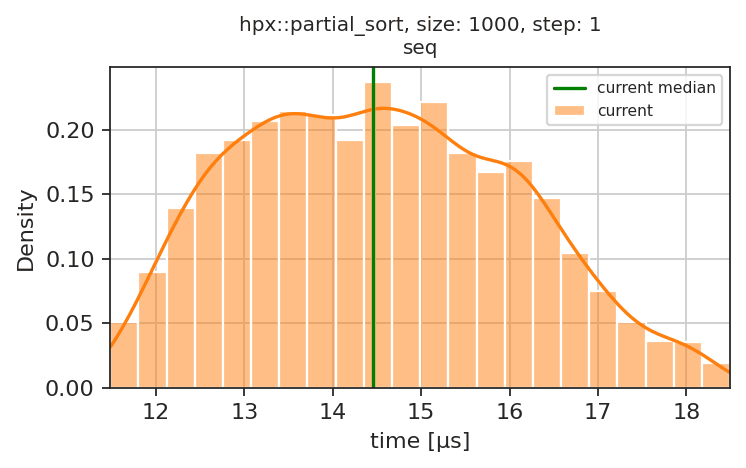
hpx::partial_sort, size: 1000, step: 1seq4.11 %+
Plot
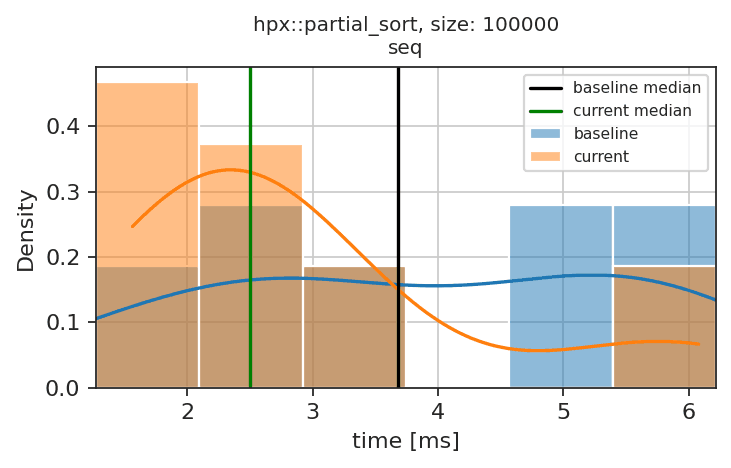
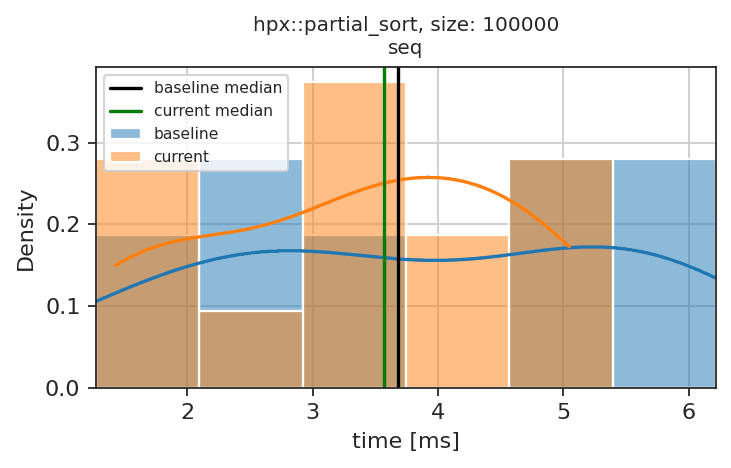
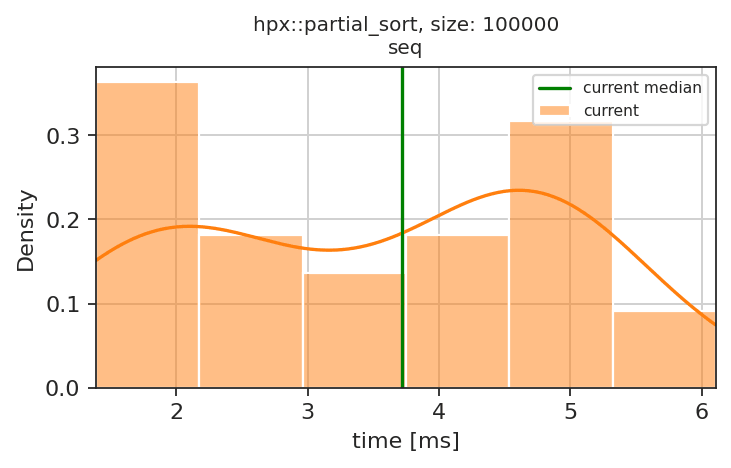
hpx::partial_sort, size: 100000seq31.98 %??
Plot
benchmark_partial_sort_parallel
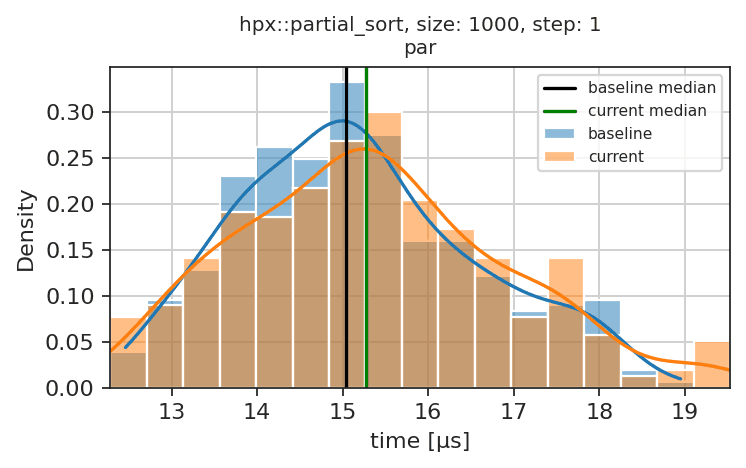
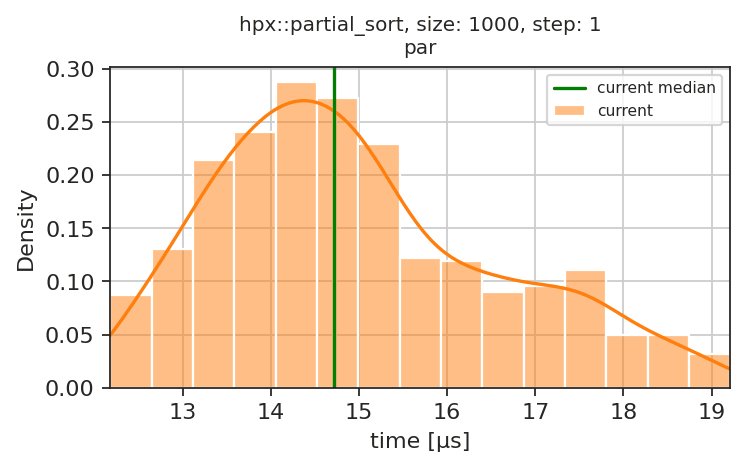
hpx::partial_sort, size: 1000, step: 1par-1.57 %?
Plot
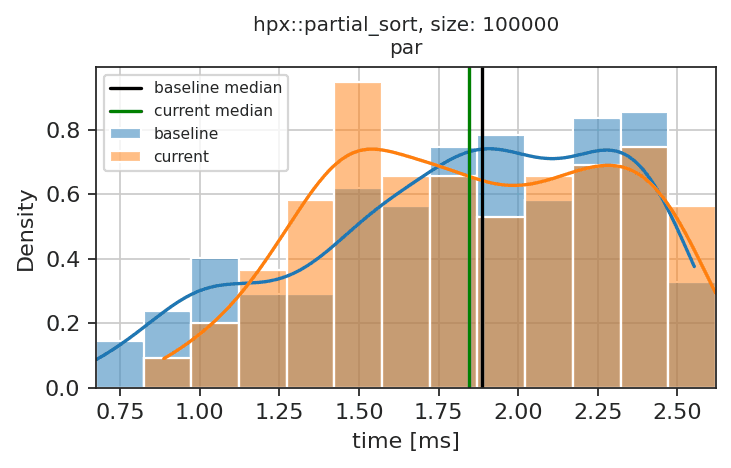
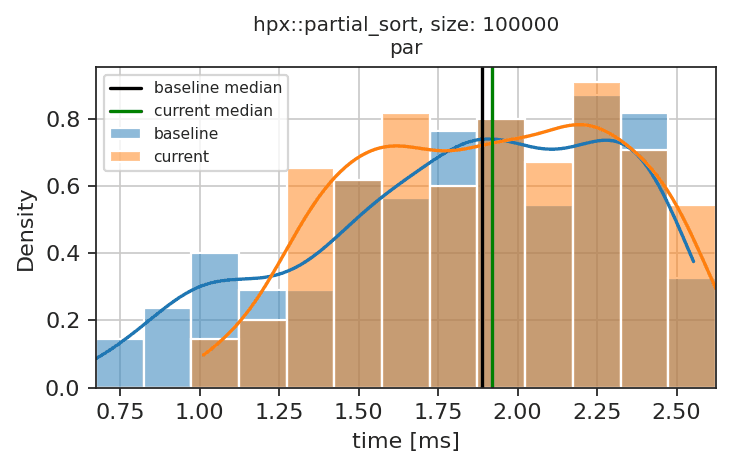
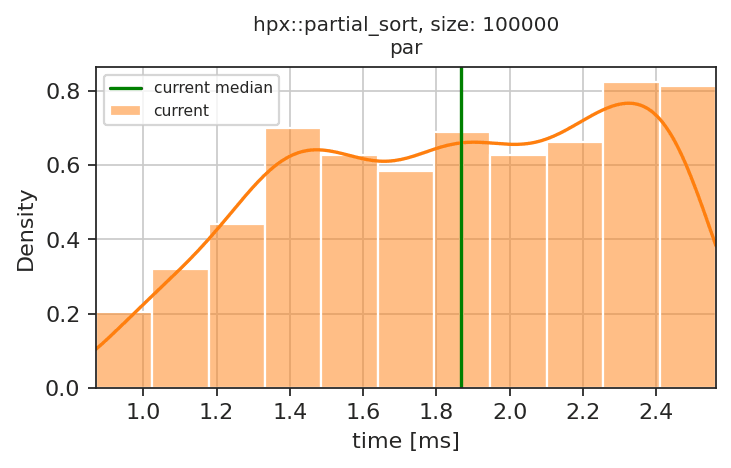
hpx::partial_sort, size: 100000par2.22 %??
Plot
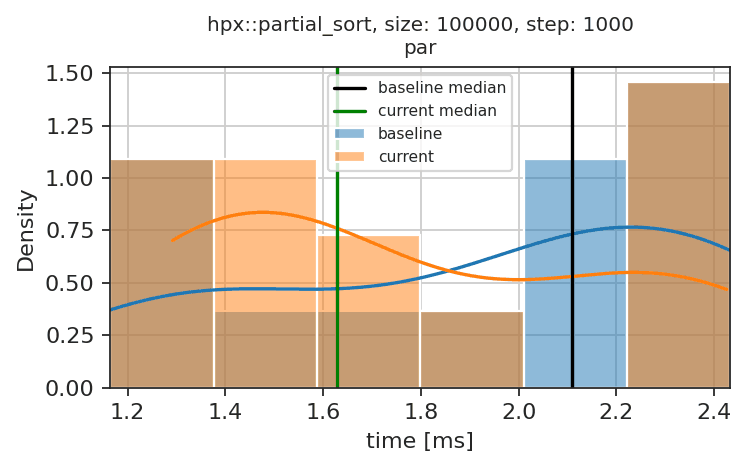
hpx::partial_sort, size: 100000, step: 1000par18.43 %??
Plot
benchmark_remove
hpx::removeseq-0.30 %(-)
Plot
hpx::removepar-0.23 %(-)
Plot
hpx::removepar_unseq-0.35 %(-)
Plot
benchmark_remove_if
hpx::remove_ifseq0.10 %(+)
Plot
foreach_report
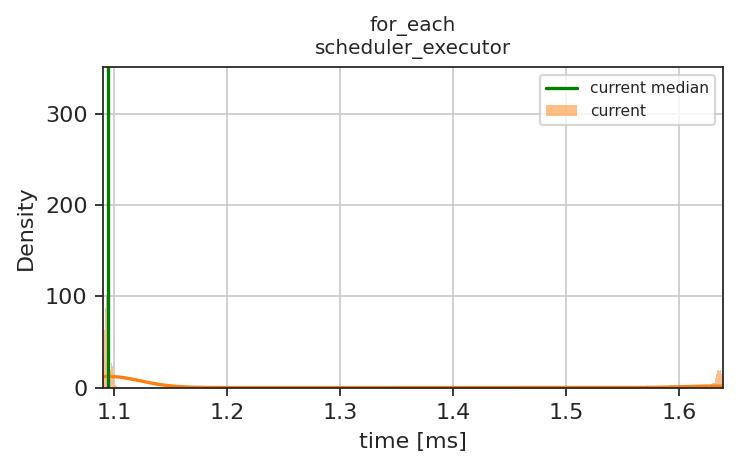
for_eachscheduler_executor0.01 %(+)
Plot
for_eachparallel_executor0.01 %(+)
Plot
for_eachfork_join_executor_nostack-0.00 %(-)
Plot
small_vector_benchmark
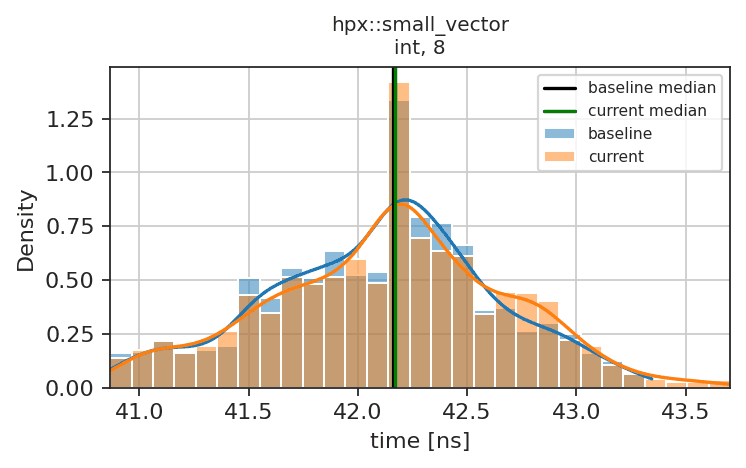
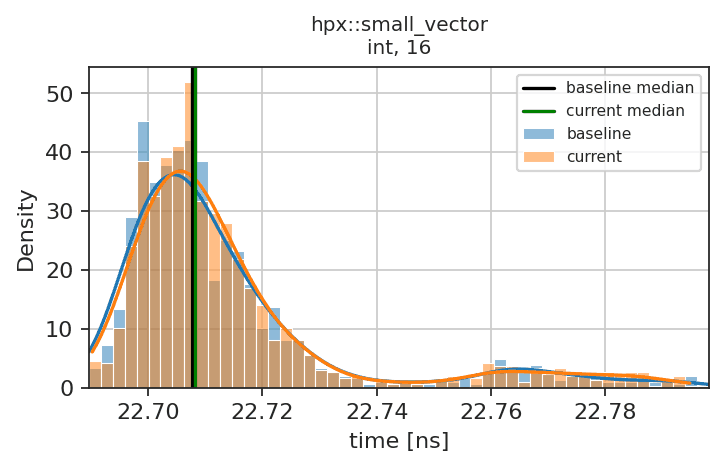
hpx::small_vectorint, 20.12 %(+)
Plot
hpx::small_vectorint, 40.16 %(+)
Plot
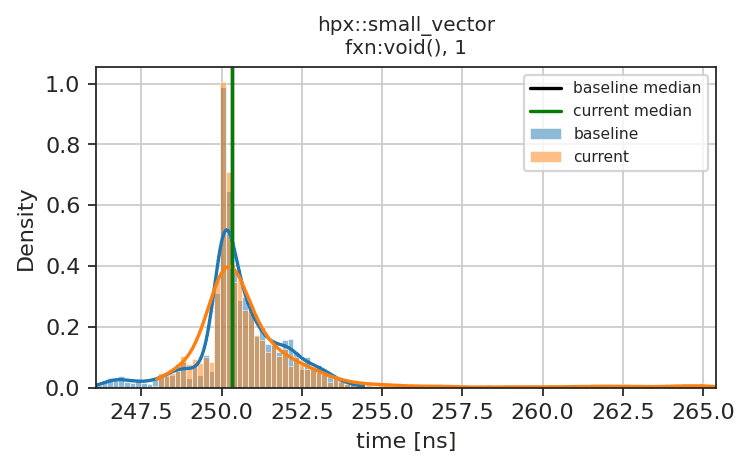
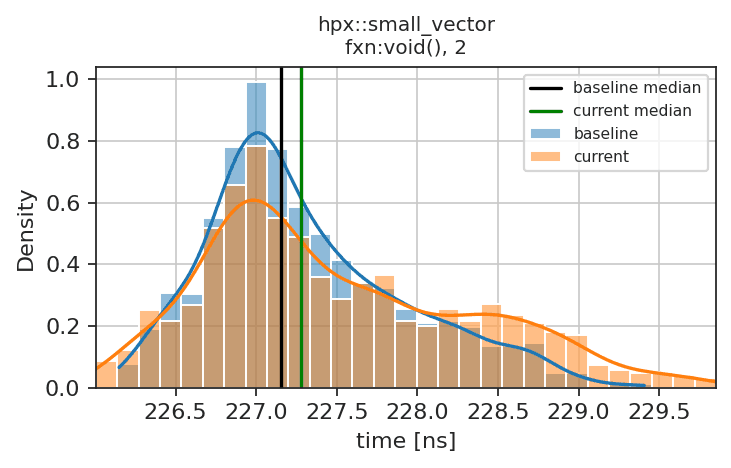
hpx::small_vectorfxn:void(), 40.08 %(+)
Plot
hpx::small_vectorfxn:void(), 80.03 %(+)
Plot
future_overhead_report
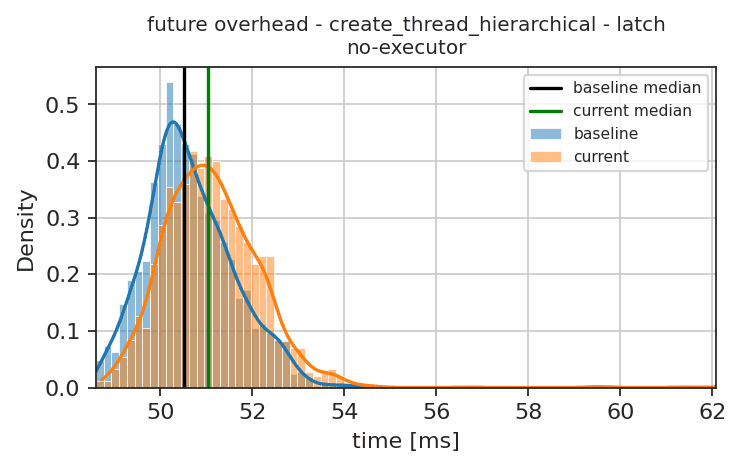
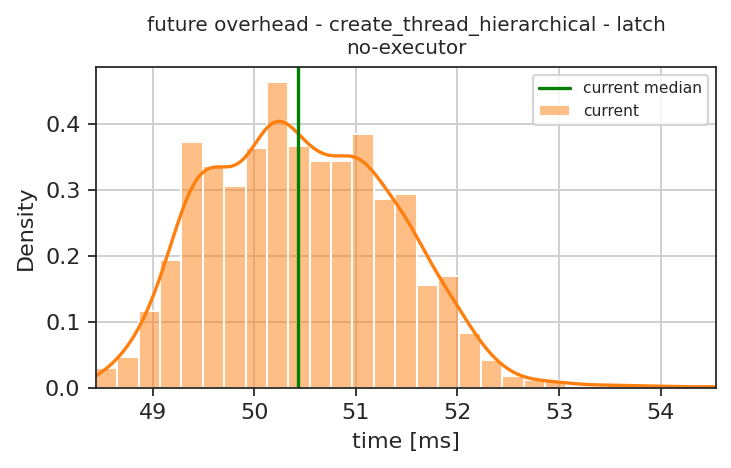
future overhead - create_thread_hierarchical - latchno-executor-1.00 %-
Plot
stream_report
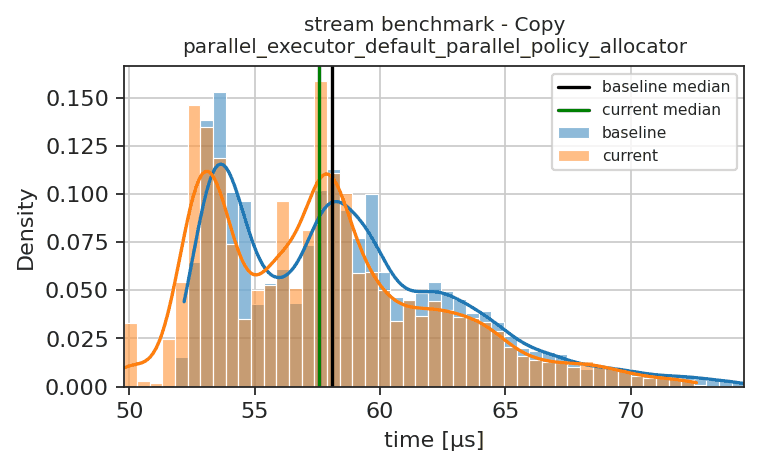
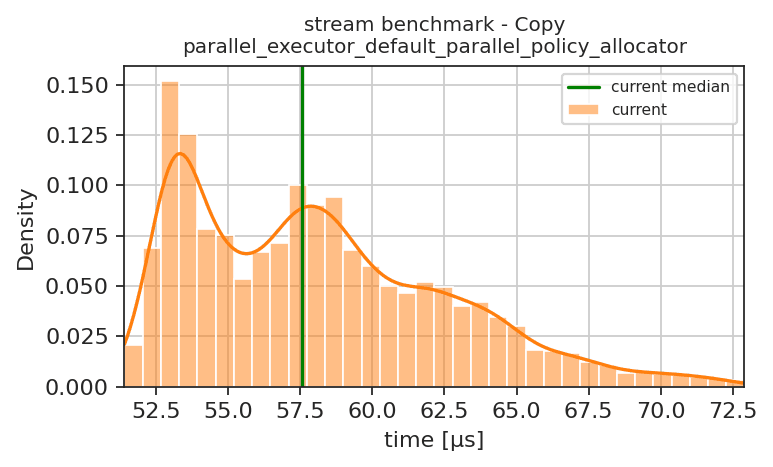
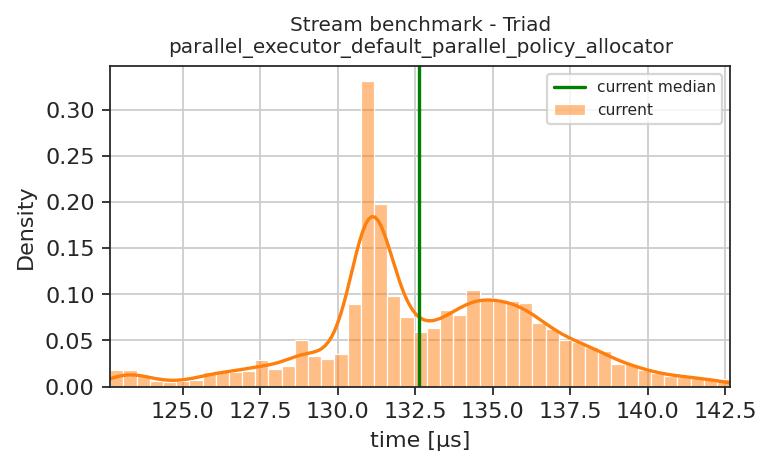
stream benchmark - Copyparallel_executor_default_parallel_policy_allocator0.90 %+
Plot
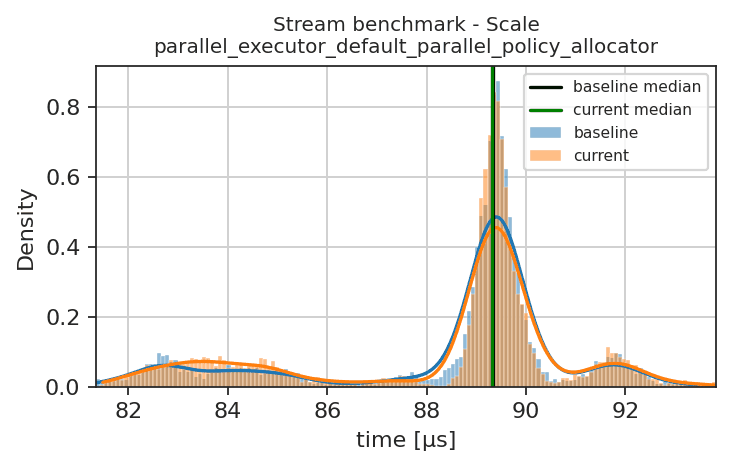
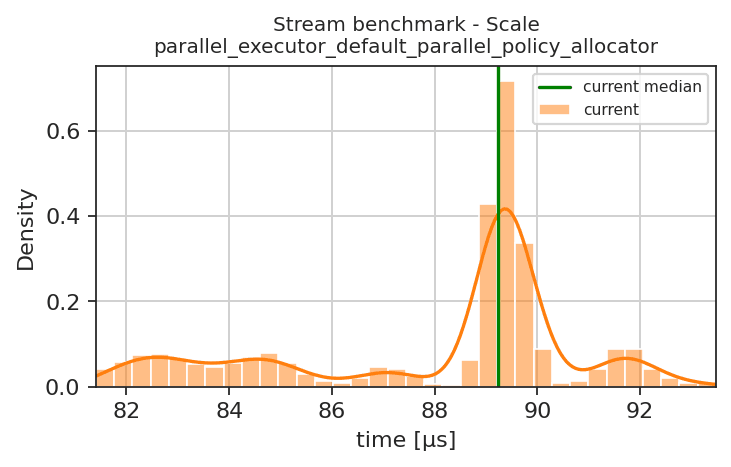
Stream benchmark - Scaleparallel_executor_default_parallel_policy_allocator0.03 %(+)
Plot
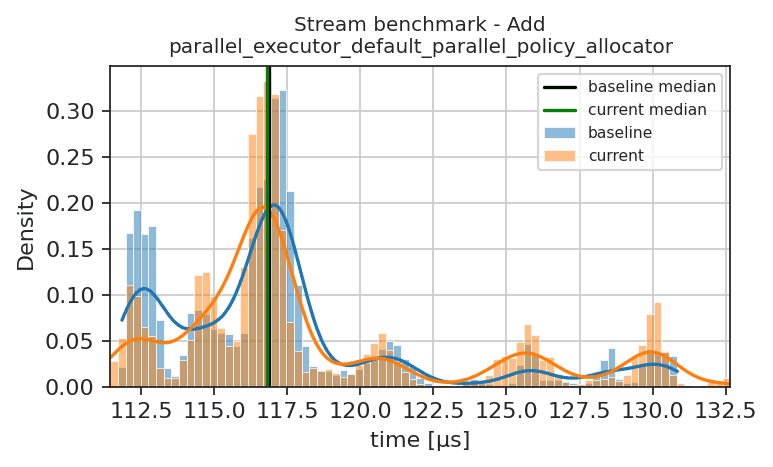
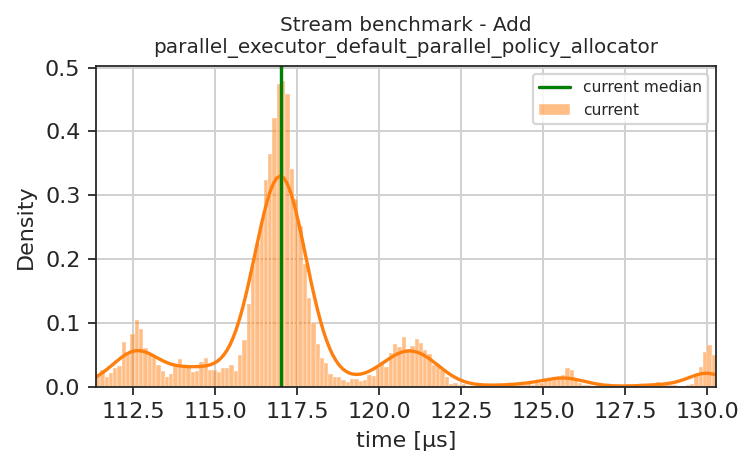
Stream benchmark - Addparallel_executor_default_parallel_policy_allocator0.05 %(+)
Plot
Stream benchmark - Triadparallel_executor_default_parallel_policy_allocator-0.69 %(-)
Plot
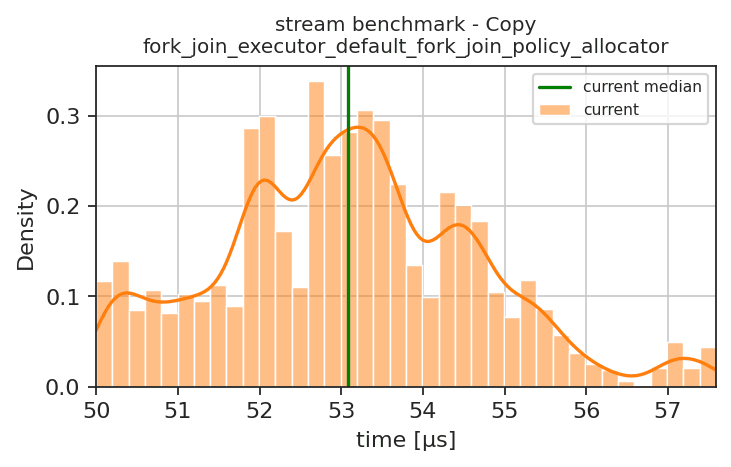
stream benchmark - Copyfork_join_executor_default_fork_join_policy_allocator0.69 %(+)
Plot
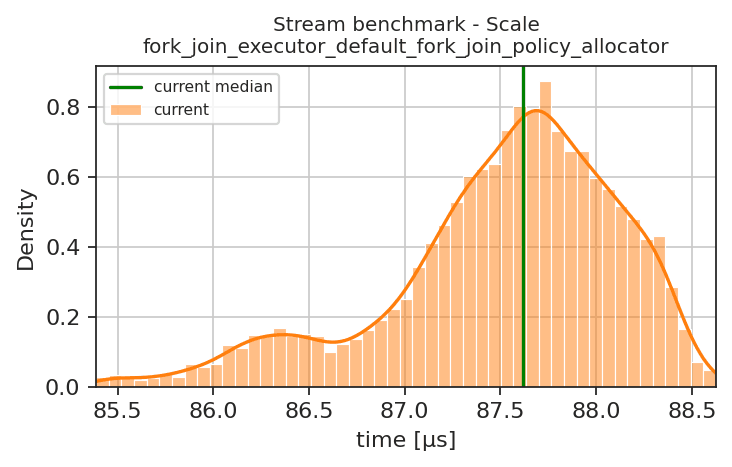
Stream benchmark - Scalefork_join_executor_default_fork_join_policy_allocator0.13 %(+)
Plot
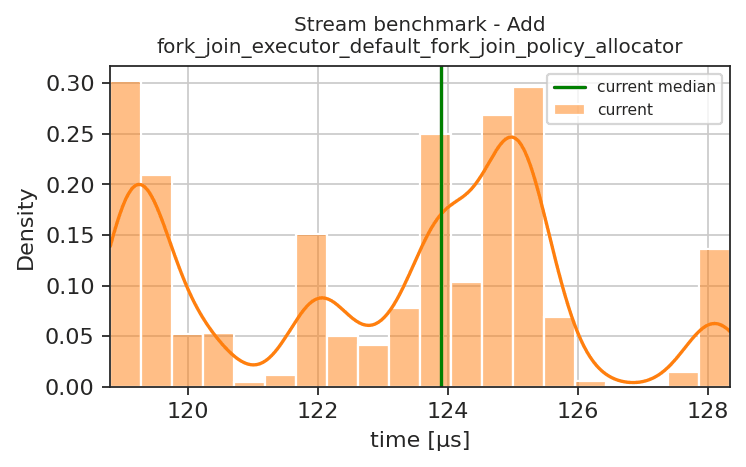
Stream benchmark - Addfork_join_executor_default_fork_join_policy_allocator1.23 %+
Plot
Stream benchmark - Triadfork_join_executor_default_fork_join_policy_allocator0.08 %(+)
Plot
stream benchmark - Copyscheduler_executor_default_scheduler_executor_allocator10.57 %+++
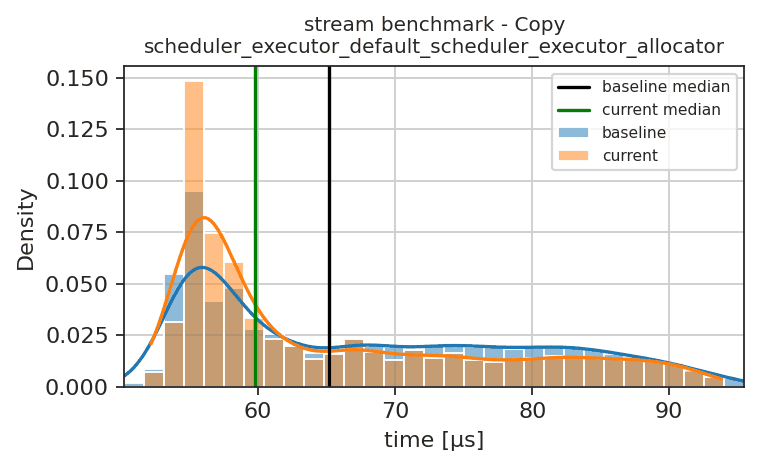
Plot
Stream benchmark - Scalescheduler_executor_default_scheduler_executor_allocator-0.25 %(-)
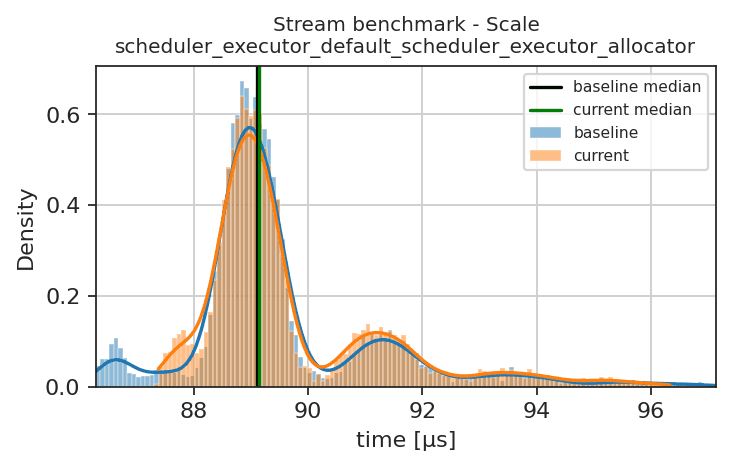
Plot
Stream benchmark - Addscheduler_executor_default_scheduler_executor_allocator-1.50 %-
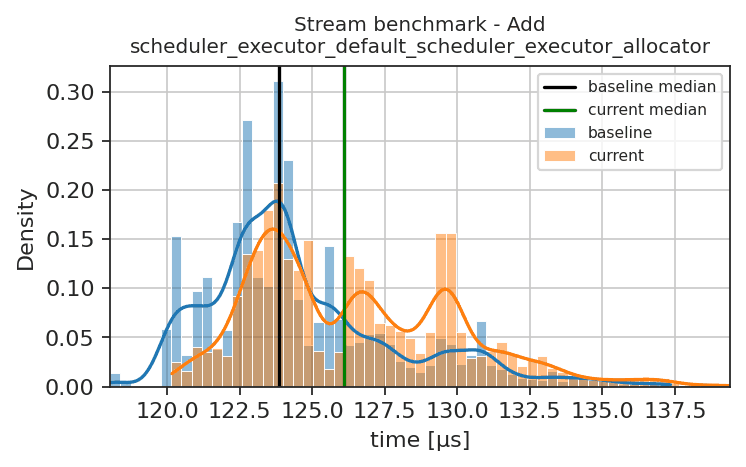
Plot
Stream benchmark - Triadscheduler_executor_default_scheduler_executor_allocator0.40 %(+)
Plot

Explanation of Symbols

The benchmarks ran on medusa08, the results are compared with the references of that node.

Percentage Diff. is the change of the median time relative to the reference, positive values mean faster.

SymbolMeaning
=No performance change (confidence interval within ±1%)
(=)Probably no performance change (confidence interval within ±2%)
(+)/(-)Very small performance improvement/degradation (≤1%)
+/-Small performance improvement/degradation (≤5%)
++/--Large performance improvement/degradation (≤10%)
+++/---Very large performance improvement/degradation (>10%)
?Probably no change, but quite large uncertainty (confidence interval within ±5%)
??Unclear result, very large uncertainty (±10%)
???Something unexpected
no referenceNo reference results for this node yet, the plot shows only the current results

@vrnimje

vrnimje commented Oct 21, 2026

Copy link
Copy Markdown
Contributor Author

@hkaiser Thanks for following up and improving the implementation. Glad to see things have stabilized. I just scanned the latest changes and it looks good to me.

@hkaiser
hkaiser force-pushed the cdash_perftest_bench branch from 048a707 to fc1b956 Compare October 21, 2026 18:22
vrnimje and others added 2 commits October 21, 2026 13:39
…ences

add_hpx_performance_report_test registers a benchmark (enabled with HPX_WITH_TESTS_RUN_BENCHMARKS) as a <name>_perftest target, which runs it a number of times through tools/perftests_ci/driver.py and collects the results; the perftests_plot target compares all results with their references in one process and writes the report (index.html), the plots and the list of measurements that got more than 5% faster or slower; only these are reported, unless HPX_PERFTESTS_REPORT_ALL is set. The timings differ between nodes, so the references are kept per node in tools/perftests_ci/perftest/references/<node>.tar.gz (packed by pack_references.sh); those of medusa08 come from a run on master. A benchmark without a reference is reported and plotted on its own. The configure step lists the registered reports in tools/perftests_ci/perftests.cmake. The other CI jobs don't run the _perftest targets.

Signed-off-by: Vedant <[email protected]>
Co-authored-by: Hartmut Kaiser <[email protected]>
Signed-off-by: Hartmut Kaiser <[email protected]>
The lsu-perftests lane builds and runs all registered performance reports in one ctest run, uploads the results to CDash, and sets a failed status only if a benchmark couldn't be built, run or compared. It comments on the pull request (with the commit, the build, what was measured, a legend, and the plots) only if a measurement got more than 5% faster or slower; the pull request comment "retest lsu perf full" starts a build that reports all measurements. The plots are uploaded to TheHPXProject/hpx-perftest-images together with a README.md that shows the report, and a README.md of the pull request lists the reports of all its builds. The job runs on the first idle medusa node, preferring medusa08 and the nodes that have references, after cancelling the previous jobs of the pull request, and gives up after three hours in the queue. The results of a node without references are uploaded packed next to the plots, ready to become its references. Every build keeps its results packed as references of its node in its artifacts. Waiting for a Slurm job reports the state of the job every ten minutes instead of tracing the wait.

Co-authored-by: Vedant <[email protected]>
Signed-off-by: Hartmut Kaiser <[email protected]>
@StellarBot

Copy link
Copy Markdown
Collaborator

Commit fc1b956826a5413cabb81ccb759393da48a85bf8, Jenkins build 6114

Performance test report
PropertyReferenceCurrent
Run date2026-10-21T07:02:15.929664-05:002026-10-21T13:33:00.669355-05:00
Hostmedusa08.rostam.cct.lsu.edumedusa08.rostam.cct.lsu.edu
Compiler/opt/apps/llvm/18.1.8/bin/clang++/opt/apps/llvm/18.1.8/bin/clang++
Test nameExecutorPercentage Diff.Classification
benchmark_inplace_merge
hpx::inplace_mergeseq-0.04 %(-)
Plot
hpx::inplace_mergepar_unseq-1.50 %-
Plot
benchmark_is_heap
hpx::is_heappar0.02 %(+)
Plot
benchmark_is_heap_until
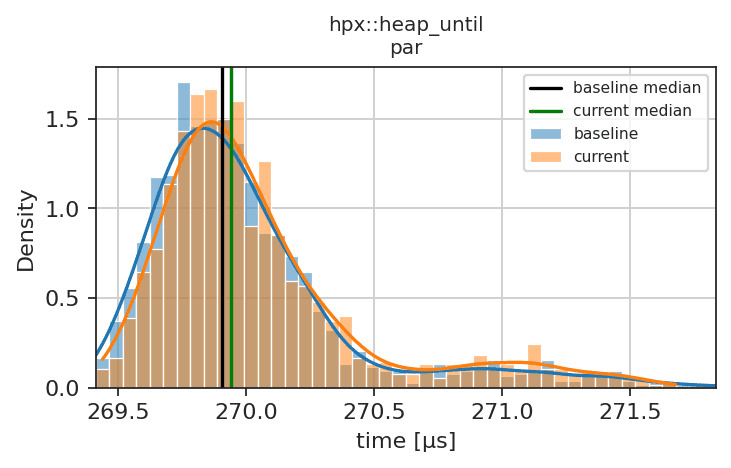
hpx::heap_untilseq0.02 %(+)
Plot
hpx::heap_untilpar0.02 %(+)
Plot
hpx::heap_untilpar_unseq0.02 %(+)
Plot
benchmark_merge
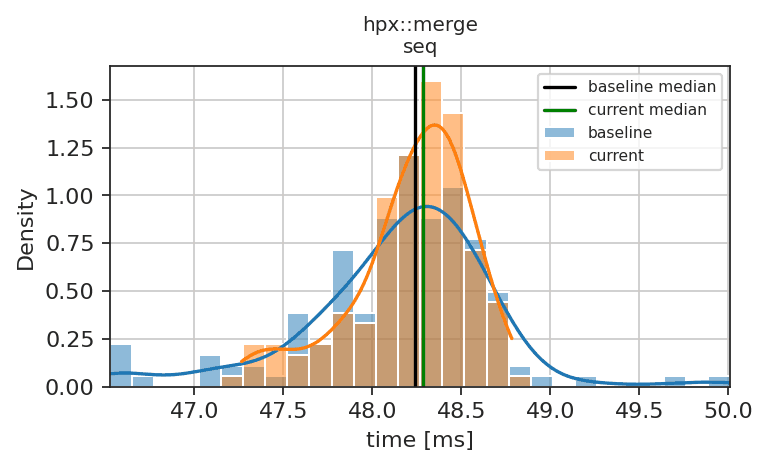
hpx::mergeseq0.96 %+
Plot
benchmark_nth_element
hpx::nth_element, size: 100000, step: 5000seq-3.46 %??
Plot
benchmark_nth_element_parallel
hpx::nth_element, size: 100000, step: 5000par2.06 %??
Plot
benchmark_partial_sort
hpx::partial_sort, size: 1000, step: 1seq1.80 %+
Plot
hpx::partial_sort, size: 100000seq-48.88 %??
Plot
benchmark_partial_sort_parallel
hpx::partial_sort, size: 1000, step: 1par3.71 %++
Plot
hpx::partial_sort, size: 100000par0.99 %?
Plot
hpx::partial_sort, size: 100000, step: 1000par19.34 %??
Plot
benchmark_remove_if
hpx::remove_ifseq0.10 %(+)
Plot
hpx::remove_ifpar_unseq-0.09 %(-)
Plot
foreach_report
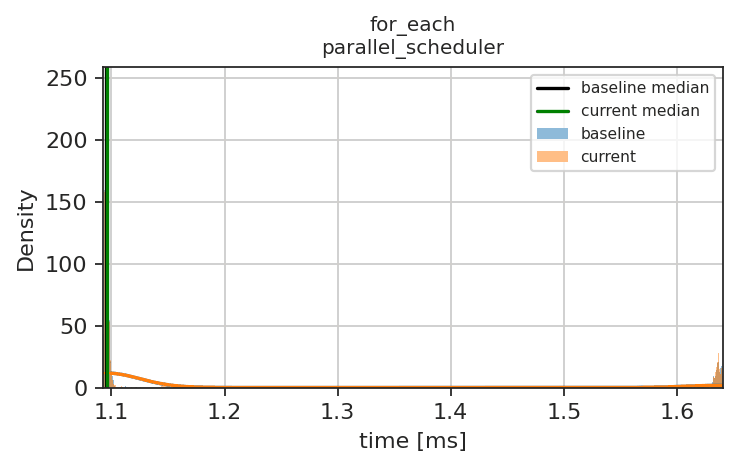
for_eachparallel_scheduler-0.01 %(-)
Plot
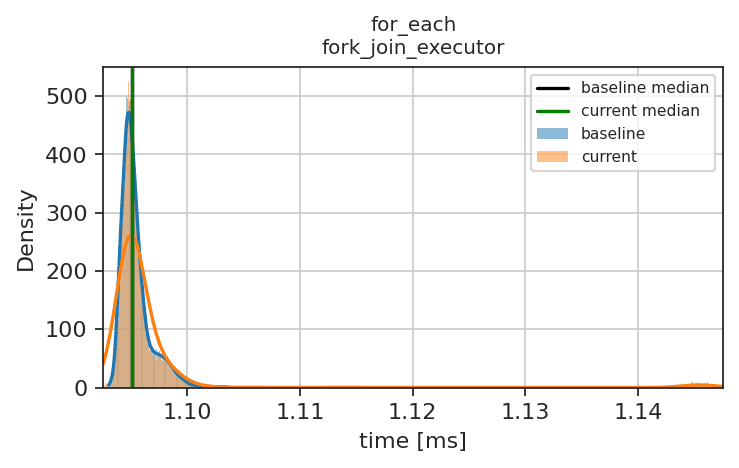
for_eachfork_join_executor-0.01 %(-)
Plot
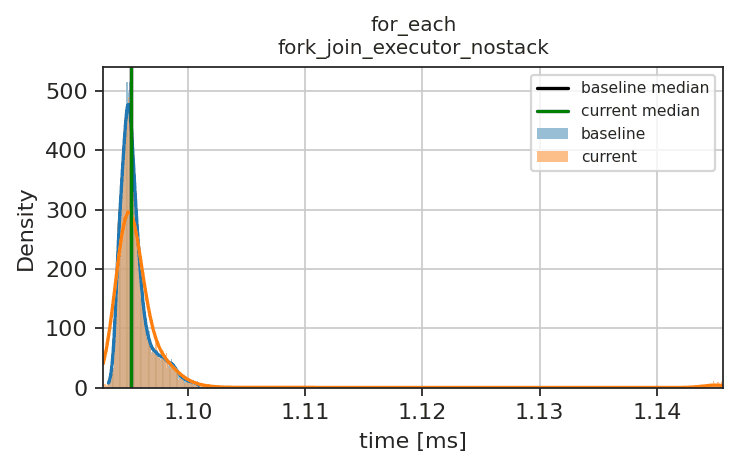
for_eachfork_join_executor_nostack-0.00 %(-)
Plot
small_vector_benchmark
hpx::small_vectorint, 20.09 %(+)
Plot
hpx::small_vectorint, 16-0.01 %(-)
Plot
hpx::small_vectorfxn:void(), 2-0.04 %(-)
Plot
hpx::small_vectorfxn:void(), 40.11 %(+)
Plot
future_overhead_report
future overhead - create_thread_hierarchical - latchno-executor-0.64 %(-)
Plot
stream_report
stream benchmark - Copyparallel_executor_default_parallel_policy_allocator2.04 %+
Plot
Stream benchmark - Scaleparallel_executor_default_parallel_policy_allocator-0.04 %(-)
Plot
Stream benchmark - Addparallel_executor_default_parallel_policy_allocator0.37 %(+)
Plot
stream benchmark - Copyfork_join_executor_default_fork_join_policy_allocator0.71 %(+)
Plot
Stream benchmark - Scalefork_join_executor_default_fork_join_policy_allocator0.22 %(+)
Plot
Stream benchmark - Addfork_join_executor_default_fork_join_policy_allocator0.51 %(+)
Plot
Stream benchmark - Triadfork_join_executor_default_fork_join_policy_allocator0.11 %(+)
Plot
stream benchmark - Copyscheduler_executor_default_scheduler_executor_allocator8.35 %++
Plot
Stream benchmark - Scalescheduler_executor_default_scheduler_executor_allocator-0.04 %(-)
Plot
Stream benchmark - Addscheduler_executor_default_scheduler_executor_allocator-1.80 %-
Plot

Explanation of Symbols

The benchmarks ran on medusa08, the results are compared with the references of that node.

Percentage Diff. is the change of the median time relative to the reference, positive values mean faster.

SymbolMeaning
=No performance change (confidence interval within ±1%)
(=)Probably no performance change (confidence interval within ±2%)
(+)/(-)Very small performance improvement/degradation (≤1%)
+/-Small performance improvement/degradation (≤5%)
++/--Large performance improvement/degradation (≤10%)
+++/---Very large performance improvement/degradation (>10%)
?Probably no change, but quite large uncertainty (confidence interval within ±5%)
??Unclear result, very large uncertainty (±10%)
???Something unexpected
no referenceNo reference results for this node yet, the plot shows only the current results

@hkaiser
hkaiser force-pushed the cdash_perftest_bench branch from fc1b956 to d954dad Compare October 21, 2026 18:46
@codacy-production

Copy link
Copy Markdown

Up to standards ✅

🟢 Issues 0 issues

Results:
0 new issues

View in Codacy

NEW Get contextual insights on your PRs based on Codacy's metrics, along with PR and Jira context, without leaving GitHub. Enable AI reviewer
TIP This summary will be updated as you push new changes.

@StellarBot

Copy link
Copy Markdown
Collaborator

Commit d954dad605bd0ca4f96ada402469bd61e82152cf, Jenkins build 6115

Performance test report
PropertyReferenceCurrent
Run date2026-10-21T07:02:15.929664-05:002026-10-21T13:58:00.448200-05:00
Hostmedusa08.rostam.cct.lsu.edumedusa08.rostam.cct.lsu.edu
Compiler/opt/apps/llvm/18.1.8/bin/clang++/opt/apps/llvm/18.1.8/bin/clang++
Test nameExecutorPercentage Diff.Classification
benchmark_inplace_merge
hpx::inplace_mergepar_unseq2.49 %++
Plot
benchmark_partial_sort_parallel
hpx::partial_sort, size: 1000, step: 1par6.32 %++
Plot
hpx::partial_sort, size: 100000par1.85 %++
Plot
stream_report
stream benchmark - Copyscheduler_executor_default_scheduler_executor_allocator8.22 %++
Plot

Explanation of Symbols

The benchmarks ran on medusa08, the results are compared with the references of that node.

Percentage Diff. is the change of the median time relative to the reference, positive values mean faster.

SymbolMeaning
=No performance change (confidence interval within ±1%)
(=)Probably no performance change (confidence interval within ±2%)
(+)/(-)Very small performance improvement/degradation (≤1%)
+/-Small performance improvement/degradation (≤5%)
++/--Large performance improvement/degradation (≤10%)
+++/---Very large performance improvement/degradation (>10%)
?Probably no change, but quite large uncertainty (confidence interval within ±5%)
??Unclear result, very large uncertainty (±10%)
???Something unexpected
no referenceNo reference results for this node yet, the plot shows only the current results

@hkaiser

hkaiser commented Oct 21, 2026

Copy link
Copy Markdown
Contributor

retest lsu perf full

@StellarBot

Copy link
Copy Markdown
Collaborator

Commit d954dad605bd0ca4f96ada402469bd61e82152cf, Jenkins build 6116, full report (requested)

Performance test report
PropertyReferenceCurrent
Run date2026-10-21T07:02:15.929664-05:002026-10-21T14:33:01.786253-05:00
Hostmedusa08.rostam.cct.lsu.edumedusa08.rostam.cct.lsu.edu
Compiler/opt/apps/llvm/18.1.8/bin/clang++/opt/apps/llvm/18.1.8/bin/clang++
Test nameExecutorPercentage Diff.Classification
benchmark_inplace_merge
hpx::inplace_mergeseq0.02 %=
Plot
hpx::inplace_mergepar0.04 %=
Plot
hpx::inplace_mergepar_unseq-0.33 %(=)
Plot
benchmark_is_heap
hpx::is_heapseq-0.02 %(-)
Plot
hpx::is_heappar0.01 %=
Plot
hpx::is_heappar_unseq-0.03 %(-)
Plot
benchmark_is_heap_until
hpx::heap_untilseq-0.01 %(-)
Plot
hpx::heap_untilpar-0.01 %(-)
Plot
hpx::heap_untilpar_unseq-0.02 %(-)
Plot
benchmark_merge
hpx::mergeseq-0.09 %=
Plot
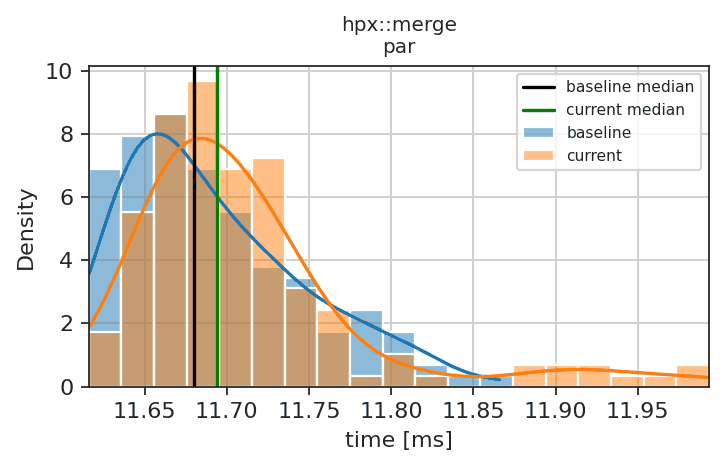
hpx::mergepar-0.12 %=
Plot
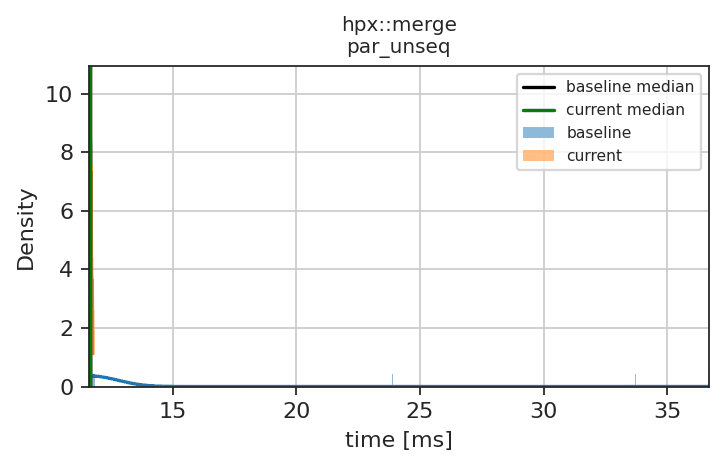
hpx::mergepar_unseq-0.02 %=
Plot
benchmark_nth_element
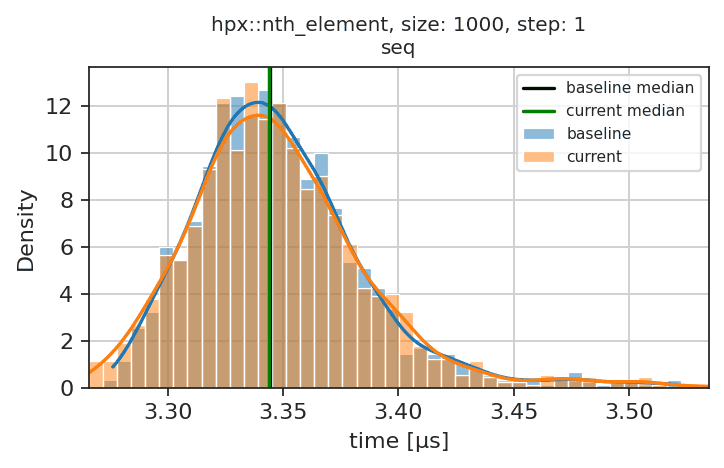
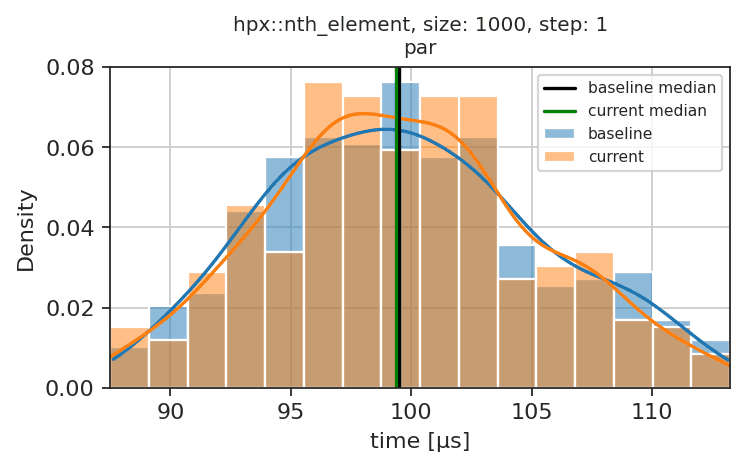
hpx::nth_element, size: 1000, step: 1seq0.02 %=
Plot
hpx::nth_element, size: 100000, step: 5000seq8.94 %??
Plot
benchmark_nth_element_parallel
hpx::nth_element, size: 1000, step: 1par0.10 %(=)
Plot
hpx::nth_element, size: 100000, step: 5000par0.27 %??
Plot
benchmark_partial_sort
hpx::partial_sort, size: 1000, step: 1seq-0.74 %(=)
Plot
hpx::partial_sort, size: 100000seq3.05 %??
Plot
benchmark_partial_sort_parallel
hpx::partial_sort, size: 1000, step: 1par-0.51 %?
Plot
hpx::partial_sort, size: 100000par-1.79 %+
Plot
hpx::partial_sort, size: 100000, step: 1000par22.75 %??
Plot
benchmark_remove
hpx::removeseq-0.11 %(-)
Plot
hpx::removepar-0.05 %=
Plot
hpx::removepar_unseq-0.14 %(-)
Plot
benchmark_remove_if
hpx::remove_ifseq-0.22 %(-)
Plot
hpx::remove_ifpar-0.31 %(-)
Plot
hpx::remove_ifpar_unseq-0.23 %(-)
Plot
foreach_report
for_eachscheduler_executor0.01 %(+)
Plot
for_eachparallel_scheduler0.00 %=
Plot
for_eachparallel_executor0.01 %(+)
Plot
for_eachfork_join_executor-0.01 %(-)
Plot
for_eachfork_join_executor_nostack-0.00 %=
Plot
transform_reduce_scaling
transform_reducepar0.26 %(+)
Plot
transform_reduce_oldpar0.11 %(+)
Plot
small_vector_benchmark
hpx::small_vectorint, 1-0.00 %=
Plot
hpx::small_vectorint, 2-0.12 %(-)
Plot
hpx::small_vectorint, 40.23 %(+)
Plot
hpx::small_vectorint, 8-0.03 %=
Plot
hpx::small_vectorint, 16-0.00 %=
Plot
hpx::small_vectorfxn:void(), 10.01 %=
Plot
hpx::small_vectorfxn:void(), 2-0.05 %(-)
Plot
hpx::small_vectorfxn:void(), 40.01 %=
Plot
hpx::small_vectorfxn:void(), 80.04 %(+)
Plot
hpx::small_vectorfxn:void(), 160.00 %=
Plot
future_overhead_report
future overhead - create_thread_hierarchical - latchno-executor-0.25 %(-)
Plot
stream_report
stream benchmark - Copyparallel_executor_default_parallel_policy_allocator0.41 %(+)
Plot
Stream benchmark - Scaleparallel_executor_default_parallel_policy_allocator0.01 %=
Plot
Stream benchmark - Addparallel_executor_default_parallel_policy_allocator0.11 %(+)
Plot
Stream benchmark - Triadparallel_executor_default_parallel_policy_allocator-0.03 %=
Plot
stream benchmark - Copyfork_join_executor_default_fork_join_policy_allocator0.39 %(+)
Plot
Stream benchmark - Scalefork_join_executor_default_fork_join_policy_allocator0.03 %(+)
Plot
Stream benchmark - Addfork_join_executor_default_fork_join_policy_allocator-0.05 %=
Plot
Stream benchmark - Triadfork_join_executor_default_fork_join_policy_allocator0.04 %(+)
Plot
stream benchmark - Copyscheduler_executor_default_scheduler_executor_allocator6.00 %++
Plot
Stream benchmark - Scalescheduler_executor_default_scheduler_executor_allocator-0.23 %(-)
Plot
Stream benchmark - Addscheduler_executor_default_scheduler_executor_allocator-0.82 %(-)
Plot
Stream benchmark - Triadscheduler_executor_default_scheduler_executor_allocator-0.04 %=
Plot

Explanation of Symbols

The benchmarks ran on medusa08, the results are compared with the references of that node.

Percentage Diff. is the change of the median time relative to the reference, positive values mean faster.

SymbolMeaning
=No performance change (confidence interval within ±1%)
(=)Probably no performance change (confidence interval within ±2%)
(+)/(-)Very small performance improvement/degradation (≤1%)
+/-Small performance improvement/degradation (≤5%)
++/--Large performance improvement/degradation (≤10%)
+++/---Very large performance improvement/degradation (>10%)
?Probably no change, but quite large uncertainty (confidence interval within ±5%)
??Unclear result, very large uncertainty (±10%)
???Something unexpected
no referenceNo reference results for this node yet, the plot shows only the current results

…tions

The comparison bootstrapped the median of all timings of all executions of a
benchmark as if they were independent. The timings of one execution depend on
each other, and most of the variation is between the executions, so the
confidence interval came out far too narrow, and the noise between executions
showed up as changes of 5 to 10 percent (e.g. the stream Copy benchmark with
the scheduler_executor). The perftest driver now records how many timings each
execution added ("executions"), and the comparison bootstraps the medians of
the executions. Replaying earlier CI runs of the same code against their
reference doesn't classify any measurement as more than 5 percent faster or
slower any more; the unstable measurements are classified as uncertain
instead.

The medusa08 references get the number of timings per execution as well, and
the benchmarks run 30 times instead of 15 by default, which makes the
interval of the medians narrower.

Signed-off-by: Hartmut Kaiser <[email protected]>
@hkaiser

hkaiser commented Oct 22, 2026

Copy link
Copy Markdown
Contributor

retest lsu perf

1 similar comment
@hkaiser

hkaiser commented Oct 22, 2026

Copy link
Copy Markdown
Contributor

retest lsu perf

A job submitted for a busy node waits for that node, even if others become idle in the meantime: when no node was idle at submission, the performance tests waited for medusa08 while other medusa nodes were free. entry.sh now waits for one of the candidate nodes to be idle before submitting, out of the same 3 hour budget as the queue, and the job fails without submitting if none becomes idle in time. The nodes with references are still preferred.

The performance tests now run in the medusa partition, which has all medusa nodes; jenkins-compute has only medusa02 to medusa10, which the build matrix keeps busy. Nodes that aren't in the partition are skipped, a job asking for them would never start.

All scripts log what they do and why, as "[perftests <time> <script>] ..." lines that stand out in the traced output: the build, the nodes with references, the idle nodes whenever they change, the chosen node, the Slurm and ctest status, every benchmark that runs, why the pull request gets a comment or not, the uploads and the GitHub status.

Signed-off-by: Hartmut Kaiser <[email protected]>
@hkaiser
hkaiser force-pushed the cdash_perftest_bench branch from 8188106 to 2b55401 Compare October 22, 2026 16:30
@StellarBot

Copy link
Copy Markdown
Collaborator

Commit 2b5540148156494a9d19a70fef9f149725cf9ba0, Jenkins build 6127

medusa00 has no references for some of the benchmarks yet. Its references, completed with the results of this run, are uploaded as medusa00.tar.gz, copy it to tools/perftests_ci/perftest/references to use them.

Performance test report
PropertyReferenceCurrent
Run dateunknown2026-10-22T11:38:44.798129-05:00
Hostunknownmedusa00.rostam.cct.lsu.edu
Compilerunknown/opt/apps/llvm/18.1.8/bin/clang++
Test nameExecutorPercentage Diff.Classification
benchmark_inplace_merge
hpx::inplace_mergeseqn/ano reference
Plot
hpx::inplace_mergeparn/ano reference
Plot
hpx::inplace_mergepar_unseqn/ano reference
Plot
benchmark_is_heap
hpx::is_heapseqn/ano reference
Plot
hpx::is_heapparn/ano reference
Plot
hpx::is_heappar_unseqn/ano reference
Plot
benchmark_is_heap_until
hpx::heap_untilseqn/ano reference
Plot
hpx::heap_untilparn/ano reference
Plot
hpx::heap_untilpar_unseqn/ano reference
Plot
benchmark_merge
hpx::mergeseqn/ano reference
Plot
hpx::mergeparn/ano reference
Plot
hpx::mergepar_unseqn/ano reference
Plot
benchmark_nth_element
hpx::nth_element, size: 1000, step: 1seqn/ano reference
Plot
hpx::nth_element, size: 100000, step: 5000seqn/ano reference
Plot
benchmark_nth_element_parallel
hpx::nth_element, size: 1000, step: 1parn/ano reference
Plot
hpx::nth_element, size: 100000, step: 5000parn/ano reference
Plot
benchmark_partial_sort
hpx::partial_sort, size: 1000, step: 1seqn/ano reference
Plot
hpx::partial_sort, size: 100000seqn/ano reference
Plot
benchmark_partial_sort_parallel
hpx::partial_sort, size: 1000, step: 1parn/ano reference
Plot
hpx::partial_sort, size: 100000parn/ano reference
Plot
hpx::partial_sort, size: 100000, step: 1000parn/ano reference
Plot
benchmark_remove
hpx::removeseqn/ano reference
Plot
hpx::removeparn/ano reference
Plot
hpx::removepar_unseqn/ano reference
Plot
benchmark_remove_if
hpx::remove_ifseqn/ano reference
Plot
hpx::remove_ifparn/ano reference
Plot
hpx::remove_ifpar_unseqn/ano reference
Plot
foreach_report
for_eachscheduler_executorn/ano reference
Plot
for_eachparallel_schedulern/ano reference
Plot
for_eachparallel_executorn/ano reference
Plot
for_eachfork_join_executorn/ano reference
Plot
for_eachfork_join_executor_nostackn/ano reference
Plot
transform_reduce_scaling
transform_reduceparn/ano reference
Plot
transform_reduce_oldparn/ano reference
Plot
small_vector_benchmark
hpx::small_vectorint, 1n/ano reference
Plot
hpx::small_vectorint, 2n/ano reference
Plot
hpx::small_vectorint, 4n/ano reference
Plot
hpx::small_vectorint, 8n/ano reference
Plot
hpx::small_vectorint, 16n/ano reference
Plot
hpx::small_vectorfxn:void(), 1n/ano reference
Plot
hpx::small_vectorfxn:void(), 2n/ano reference
Plot
hpx::small_vectorfxn:void(), 4n/ano reference
Plot
hpx::small_vectorfxn:void(), 8n/ano reference
Plot
hpx::small_vectorfxn:void(), 16n/ano reference
Plot
future_overhead_report
future overhead - create_thread_hierarchical - latchno-executorn/ano reference
Plot
stream_report
stream benchmark - Copyparallel_executor_default_parallel_policy_allocatorn/ano reference
Plot
Stream benchmark - Scaleparallel_executor_default_parallel_policy_allocatorn/ano reference
Plot
Stream benchmark - Addparallel_executor_default_parallel_policy_allocatorn/ano reference
Plot
Stream benchmark - Triadparallel_executor_default_parallel_policy_allocatorn/ano reference
Plot
stream benchmark - Copyfork_join_executor_default_fork_join_policy_allocatorn/ano reference
Plot
Stream benchmark - Scalefork_join_executor_default_fork_join_policy_allocatorn/ano reference
Plot
Stream benchmark - Addfork_join_executor_default_fork_join_policy_allocatorn/ano reference
Plot
Stream benchmark - Triadfork_join_executor_default_fork_join_policy_allocatorn/ano reference
Plot
stream benchmark - Copyscheduler_executor_default_scheduler_executor_allocatorn/ano reference
Plot
Stream benchmark - Scalescheduler_executor_default_scheduler_executor_allocatorn/ano reference
Plot
Stream benchmark - Addscheduler_executor_default_scheduler_executor_allocatorn/ano reference
Plot
Stream benchmark - Triadscheduler_executor_default_scheduler_executor_allocatorn/ano reference
Plot

Explanation of Symbols

The benchmarks ran on medusa00, the results are compared with the references of that node.

Percentage Diff. is the change of the median time relative to the reference, positive values mean faster.

SymbolMeaning
=No performance change (confidence interval within ±1%)
(=)Probably no performance change (confidence interval within ±2%)
(+)/(-)Very small performance improvement/degradation (≤1%)
+/-Small performance improvement/degradation (≤5%)
++/--Large performance improvement/degradation (≤10%)
+++/---Very large performance improvement/degradation (>10%)
?Probably no change, but quite large uncertainty (confidence interval within ±5%)
??Unclear result, very large uncertainty (±10%)
???Something unexpected
no referenceNo reference results for this node yet, the plot shows only the current results

@hkaiser hkaiser added this to the 2.0.0 milestone Oct 22, 2026
To follow the performance of HPX over time, the performance tests of every master commit that is built are now added to the performance history in TheHPXProject/hpx-performance. These runs always run on the same node, medusa00 (configuration_slurm_history_node), so that they can be compared with each other; it is not in jenkins-compute, so the build matrix never runs on it. They wait up to a day for it and report all measurements.

batch.sh records the run with tools/perftests_ci/perftests_record.py: the commit (hash, parents, dates, pull request, position on the first parent history), when and where the benchmarks ran, the Jenkins build, the configuration and the status (metadata.json), and the medians of all measurements, overall and per execution (summary.json). entry.sh uploads it with upload_history.sh, also if some of the benchmarks failed; a failed upload turns the status red.

Each run gets its own directory, <year>/<node>/<commit date>-<commit>-b<build>, with its report, the record and the results of all benchmarks as measured; the plots of the comparison are left out, perftests_plot.py can draw them again. runs.tsv lists all runs and timeline.csv the medians of all measurements of all runs. With every run, tools/perftests_ci/perftests_timeline.py draws a graph per benchmark over time (SVG, so that the repository stores only their differences), which the README of the repository shows. tools/perftests_ci/perftests_history.py rebuilds timeline.csv from the run directories, optionally for one node, one benchmark or a range of dates. The commits are made as the STE||AR-Bot, and the first run sets up the empty repository with the Boost license.

Signed-off-by: Hartmut Kaiser <[email protected]>
A benchmark that is new, or whose measurements changed, has no reference on the node the performance tests ran on. All references of that node are now made again from the run, so that they are measured together, instead of adding only the results of the new benchmark to the existing references. A benchmark whose measurements differ from its reference counts as one without a reference instead of failing the comparison.

The new references are uploaded to TheHPXProject/hpx-perftest-images in any case: also if the pull request gets no comment, and for builds of a branch (as branch/<branch>/<build>). A failed upload turns the status red.

Signed-off-by: Hartmut Kaiser <[email protected]>
The results of all benchmarks of Jenkins build 6127 on medusa00, as uploaded to TheHPXProject/hpx-perftest-images (pr/6514/6127/references/medusa00.tar.gz), so that pull requests that run on medusa00 are compared with them.

Signed-off-by: Hartmut Kaiser <[email protected]>
@hkaiser
hkaiser force-pushed the cdash_perftest_bench branch from 78f2d3e to 14cef03 Compare October 22, 2026 20:49
@hkaiser
hkaiser merged commit 2ea4725 into TheHPXProject:master Oct 22, 2026
49 of 52 checks passed
hkaiser added a commit that referenced this pull request Oct 22, 2026
Restore the release notes update that was lost when release-2.0.X was rebuilt on master eaff5b9, and describe the PRs merged since the previous rebuild (#6514, #7767, #7816, #7817, #7819, #7821, #7824, #7831). Regenerate the closed issue and pull request lists for release-2.0.X at 4cb902e against the v1.11.0 tag (775 PRs, 167 issues).

Signed-off-by: Hartmut Kaiser <[email protected]>
Sign up for free to join this conversation on GitHub. Already have an account? Sign in to comment

Labels

Projects

None yet

Development

Successfully merging this pull request may close these issues.

6 participants