library(tinyplot)
dat = data.frame(x = rnorm(200), y = rep(LETTERS[1:2], each = 100))
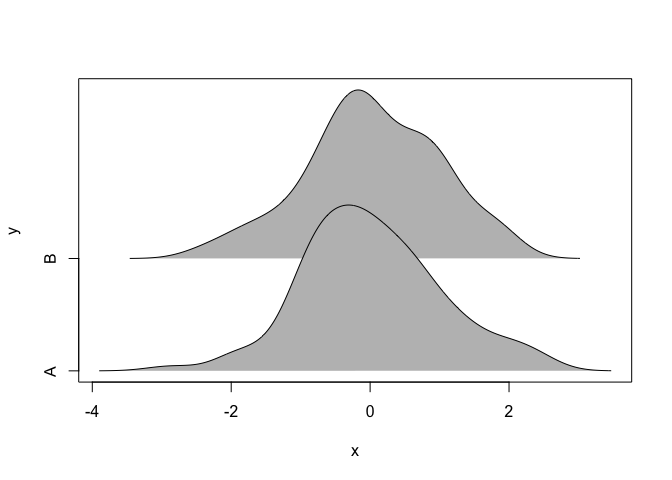
plt(y ~ x, dat, type = "ridge") # default theme = fine (same for "ridge(2)", "clean(2)", etc.)
plt(y ~ x, dat, type = "ridge", theme = "classic") # fails
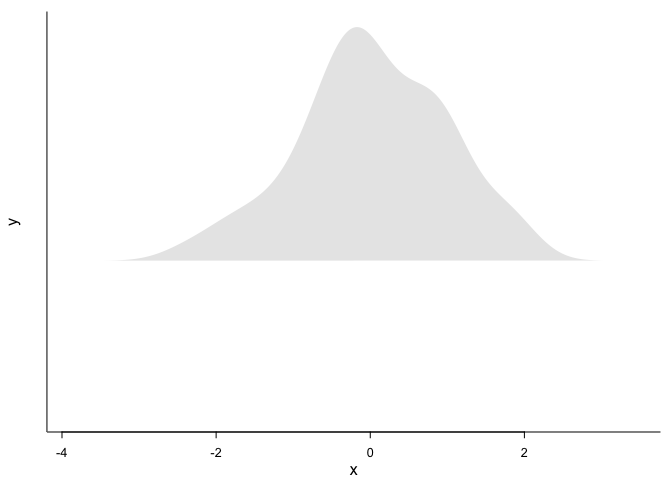
#> Error in `plot.xy()`:
#> ! numerical color values must be >= 0, found -1
Created on 2026-08-31 with reprex v2.1.1
Created on 2026-08-31 with reprex v2.1.1