Working towards a fix of #441 and #471, I've identified four potential improvements to type_summary() that we should consider making:
1. type_summary() should call aggregate() instead of ave().
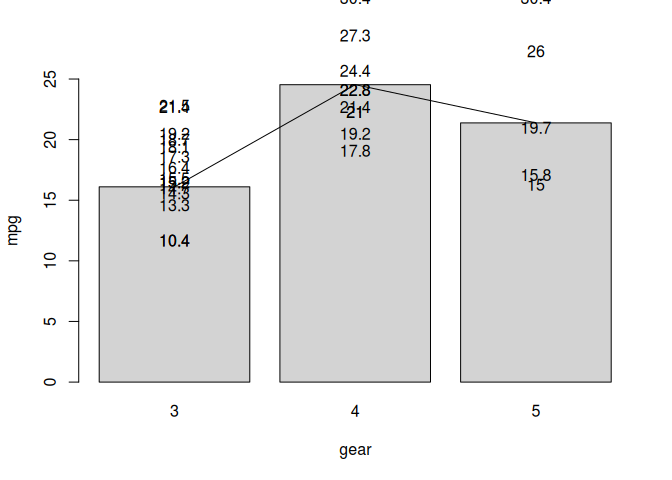
There's no need to retain the original, full data length as long as we retain the unique values of x. Worse, we're currently "overplotting" each x point with multiple versions of the same y value. No brainer to fix.
2. type_summary() should accept a dodge argument
For grouped summaries that share the same x values. This is a necessary step towards resolving both #441 and #471. Another no-brainer IMO.
3.type_summary() should be able to produce text
In other words, it should accept a type = "text" argument (with appropriate routing to text() instead of lines() for drawing). Necessary for #471 and any other cases where we want to add textual summaries to base plots that aggregate multiple-y-per-x cases via a FUN/fun transformation. For example, aggregated barplots:
plt(mpg ~ gear, data = mtcars, type = "barplot")
plt_add(type = type_summary())
plt_add(type = type_text(pos = 3, xpd = NA))
Manual version of what we want:
plt(mpg ~ gear, data = mtcars, type = "barplot")
plt_add(data = round(aggregate(mpg ~ gear, data = mtcars, FUN = mean), 1),
        type = type_text(pos = 3, xpd = NA))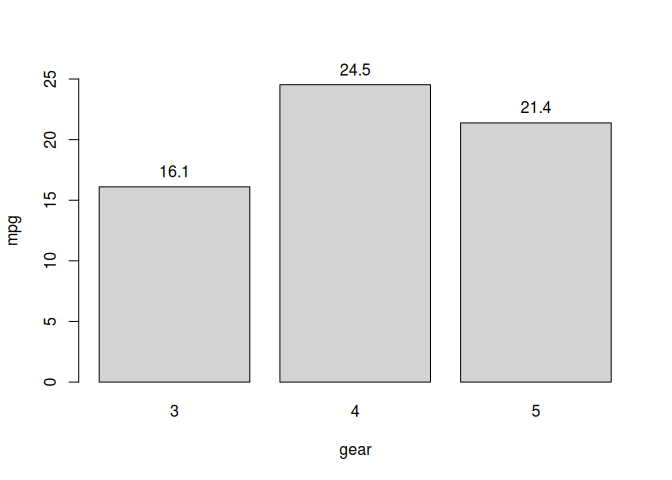
Of course, as suggested by my manual example, an alternative approach is allowing type_text() itself to take an aggregating function argument. But this feels like scope creep and more clunky to me.
4. type_summary(type = "p") should be the default (maybe?)
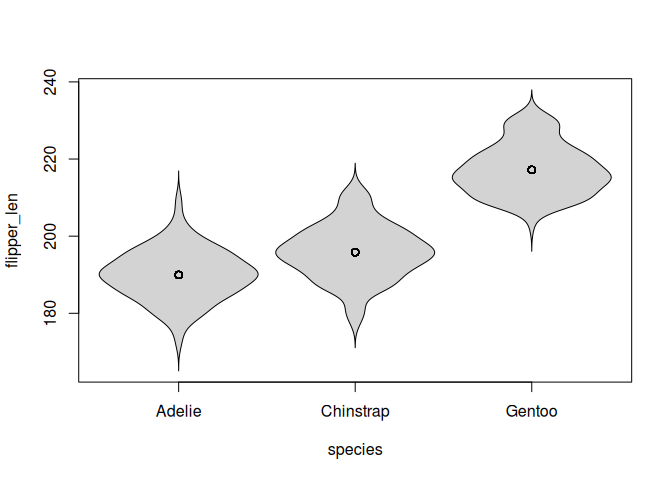
This one I'm a little less confident about, especially since it would be a breaking change from the current default, i.e., type_summary(type = "l"). But I think it would be more consistent with (typical) plotting defaults. Similarly, lines (usually) don't make sense when you are layering on top of plots with a categorical x-axis, e.g.:
library("tinyplot")
plt(flipper_len ~ species, data = penguins,  type = "violin")
plt_add(type = "summary")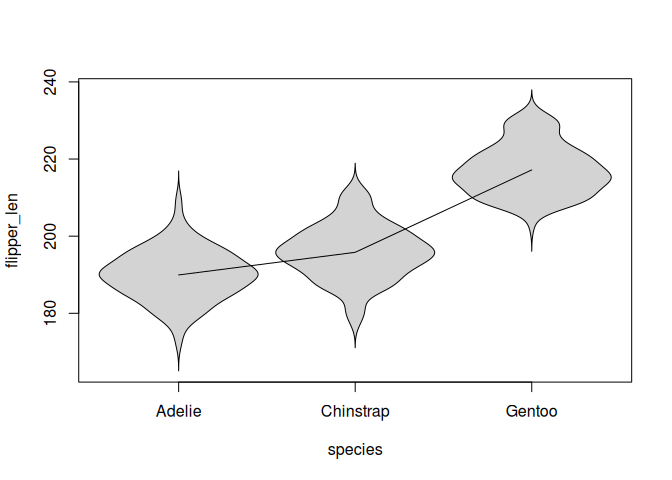
versus
plt(flipper_len ~ species, data = penguins, type = type_violin())
plt_add(type = type_summary(type = "p"))
A similar argument could be made for type_function(). @vincentarelbundock I'd be curious on your thoughts (since you added this latter type).
Working towards a fix of #441 and #471, I've identified four potential improvements to
type_summary()that we should consider making:1.
type_summary()should callaggregate()instead ofave().There's no need to retain the original, full data length as long as we retain the unique values of
x. Worse, we're currently "overplotting" each x point with multiple versions of the same y value. No brainer to fix.2.
type_summary()should accept adodgeargumentFor grouped summaries that share the same x values. This is a necessary step towards resolving both #441 and #471. Another no-brainer IMO.
3.
type_summary()should be able to produce textIn other words, it should accept a
type = "text"argument (with appropriate routing totext()instead oflines()for drawing). Necessary for #471 and any other cases where we want to add textual summaries to base plots that aggregate multiple-y-per-x cases via aFUN/funtransformation. For example, aggregated barplots:Manual version of what we want:
Of course, as suggested by my manual example, an alternative approach is allowing
type_text()itself to take an aggregating function argument. But this feels like scope creep and more clunky to me.4.
type_summary(type = "p") should be the default (maybe?)This one I'm a little less confident about, especially since it would be a breaking change from the current default, i.e.,
type_summary(type = "l"). But I think it would be more consistent with (typical) plotting defaults. Similarly, lines (usually) don't make sense when you are layering on top of plots with a categorical x-axis, e.g.:versus
A similar argument could be made for
type_function(). @vincentarelbundock I'd be curious on your thoughts (since you added this latter type).